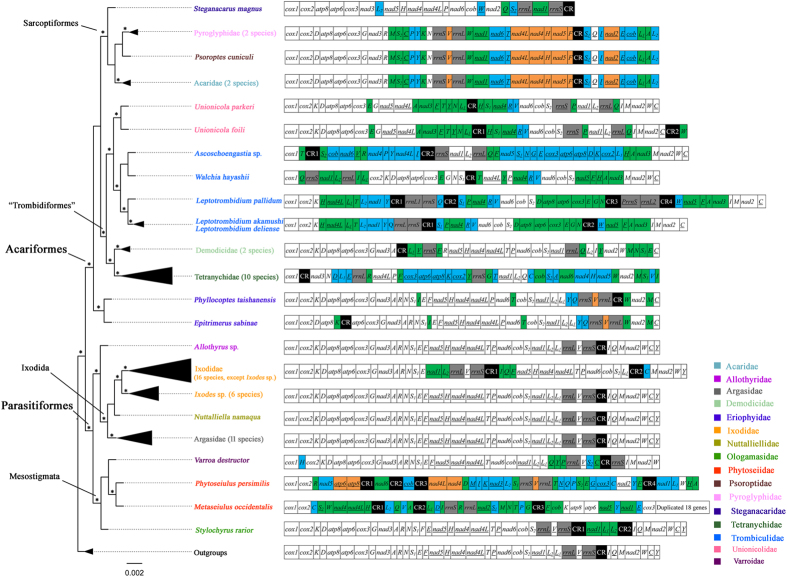
Figure 5. Maximum likelihood trees inferred with nucleotide sequences by 16 partitions (13 PCGs, 2 rRNA genes and concatenated tRNA genes).
Asterisks indicate the branches with >75% BSPs and>95% BPPs in the majority of the 13 topologies (Figures S1 and S2). Translocated genes are in green; inverted genes are in orange; inverted and translocated genes are in blue. rRNAs are in grey. Control regions are in black. Abbreviations of gene names are the same as in Fig. 1. Genes are transcribed from left to right except for those underlined, which are transcribed from right to left.

