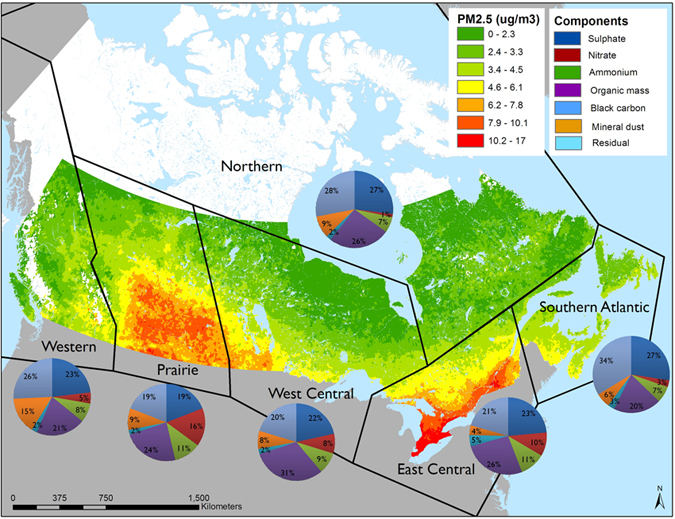
Figure 1.

Median concentrations of PM2.5 (2001–2010) and relative component proportions by airshed. Map created in ArcGIS Desktop 10.2. ESRI, Redlands, CA.

Median concentrations of PM2.5 (2001–2010) and relative component proportions by airshed. Map created in ArcGIS Desktop 10.2. ESRI, Redlands, CA.