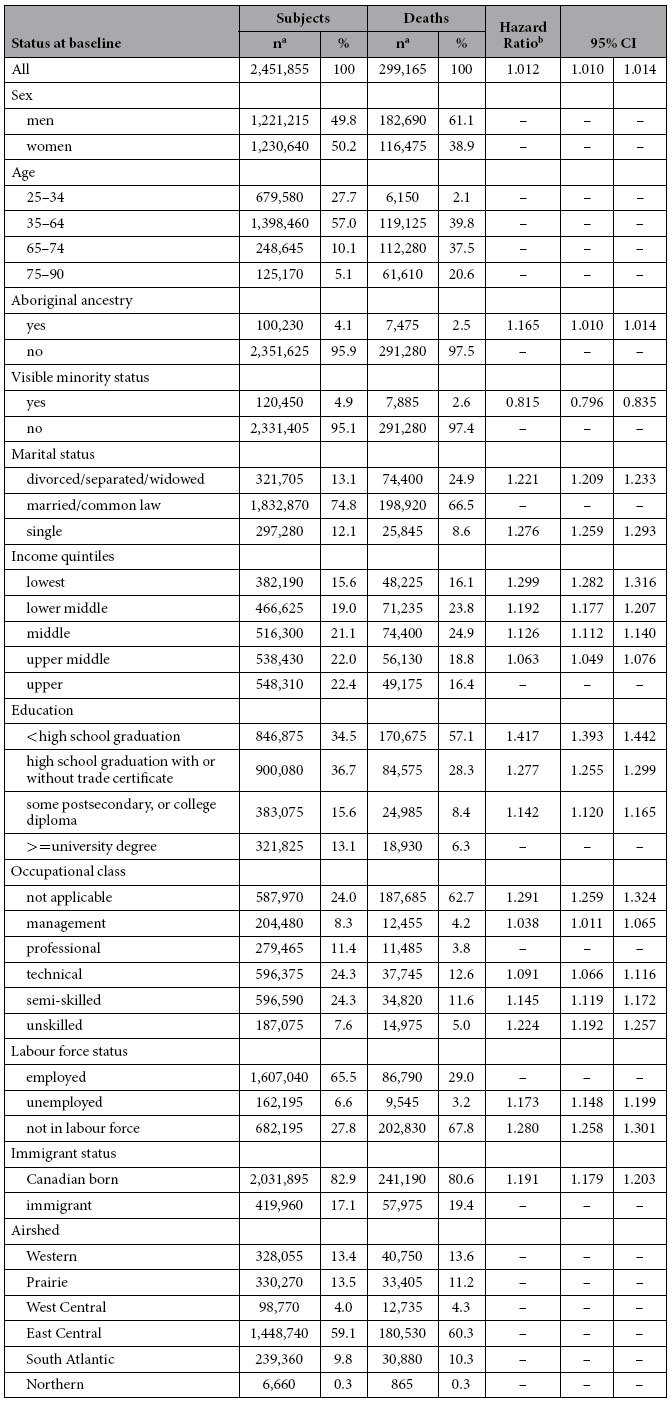
Table 1. Descriptive statistics of cohort subjects at baseline and fully-adjusted hazard ratios for risk factors included in the survival models for all non-accidental causes of death.

asubject counts rounded to nearest 5; percentages based on original values.
bfrom models adjusted for the following personal covariates: PM2.5, aboriginal ancestry, visible minority status, highest level of education, employment status, occupational class, immigrant status, marital status, and income quintile; and the following contextual covariates: CD and CT-CD % of immigrants, % of adults without high school diploma, % of subjects in lowest income quintile; models stratified by age, sex, and airshed; hazard ratios per μg/m3 increment in exposure to PM2.5.
