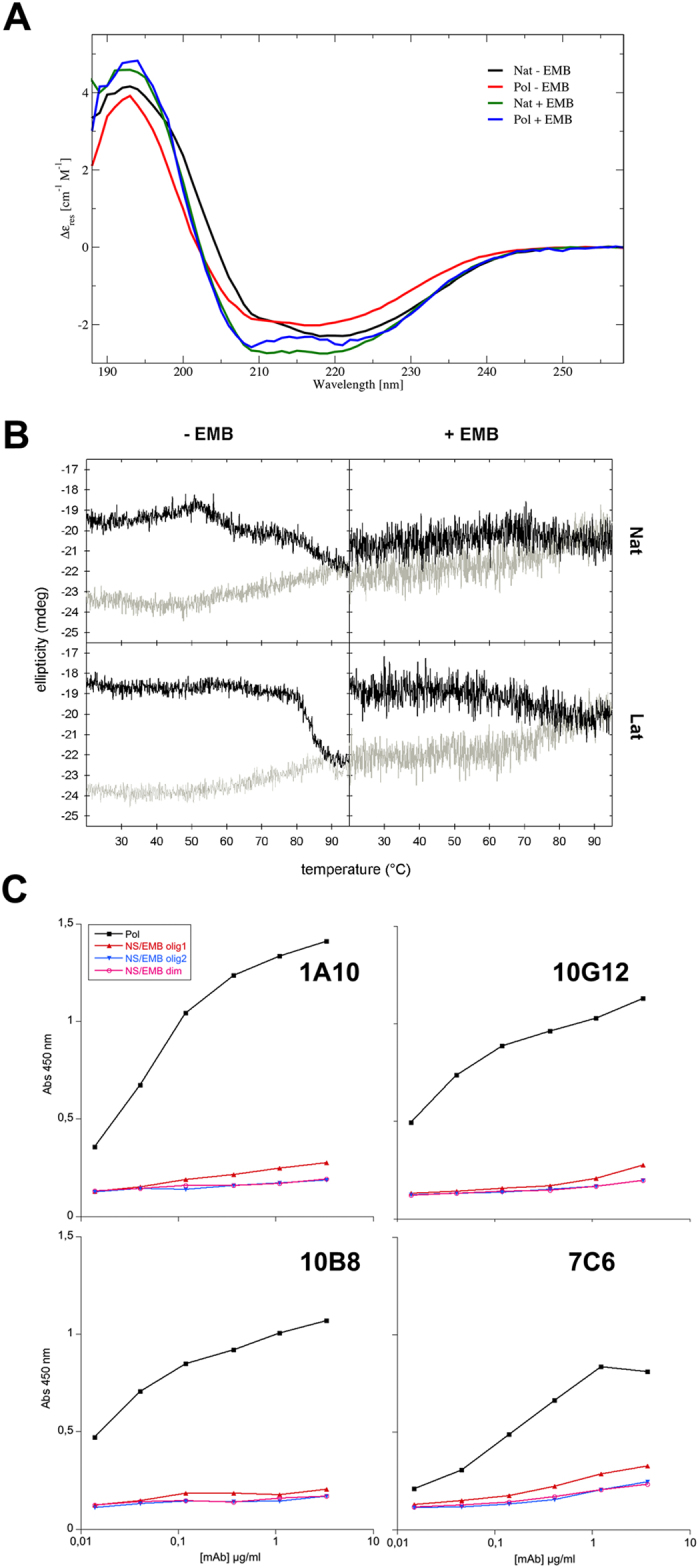
Figure 5. Analysis of the interaction between NS and EMB by circular dichroism (CD).

(A) CD spectra of Nat and Pol with or without EMB: Nat (black line); Pol (red line); Nat and Pol incubated for 2 hours at 55 °C with EMB (green line and blue line, respectively). (B) Temperature ramps of Nat and Lat alone (−EMB) and in the presence of EMB (+EMB) monitored through far-UV CD at 218 nm. The black lines indicate the CD signal of the samples heated up from 20 to 95 °C; the grey lines correspond to samples cooled down from 95 to 20 °C. (C) The affinity of four different anti-NS monoclonal mAb (1A10, 10B8, 10G12 and 7C6) against NS was measured by sandwich ELISA on four gel filtered species: Pol; NS/EMB olig1 (NS/EMB largest oligomers eluted at 8.5–9 ml as in Fig. 1A); NS/EMB olig2 (NS/EMB smaller oligomers eluted at 10–10.5 ml as in Fig. 1A); and NS/EMB dim (NS/EMB dimers eluted at 12.5 ml as in Fig. 1A).
