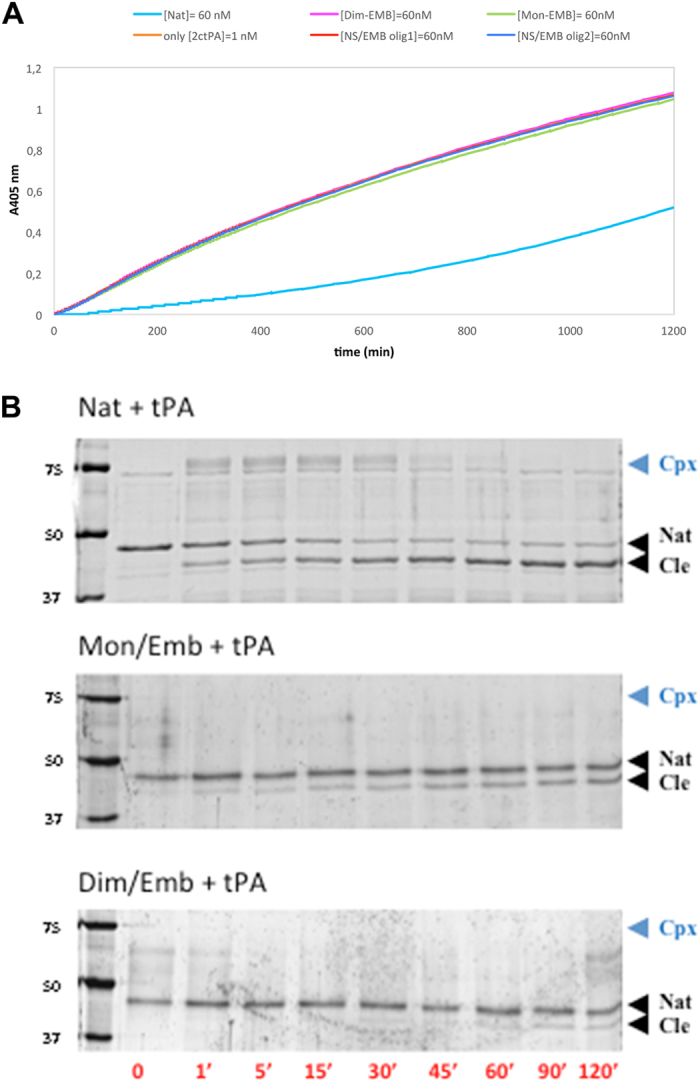
Figure 6. Inhibition of 2ctPA by NS/EMB complex.

(A) Chromogenic 2ctPA inhibition assays following the hydrolysis of IPR-pNA (250 μM) by 2ctPA (1 nM) alone (orange curve) in the presence of Nat (cyan) and of NS/EMB complex at different oligomeric states (60 nM): monomer (green), dimer (magenta), largest oligomers eluted at 8.5–9 ml as in Fig. 1A (olig1, red), smaller oligomers eluted at 10–10.5 ml as in Fig. 1A (olig2, blue). (B) Nat, monomeric or dimeric NS/EMB complex (2.4 μM) were incubated with 2ctPA (0.4 μM) as in A and the samples analysed by SDS-PAGE. Lane 1: molecular marker; lane 2: Nat; lanes 3–10: 1, 5, 15, 30, 45, 60, 90, and 120 min time points. Nat, Cle and acyl-enzyme complex of NS with 2ctPA (cpx) bands are indicated.
