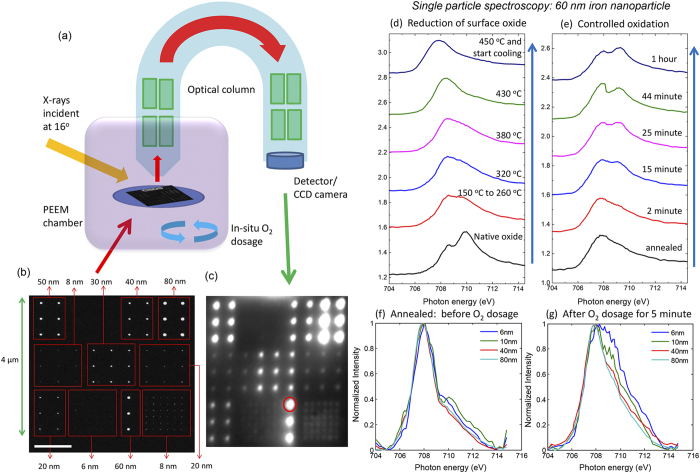
Figure 1. Single particle spectroscopy on iron nanoparticles.
(a) Schematic of the PEEM setup for in-situ single nanoparticle spectro-microscopy. (b) SEM image of iron nanoparticles of nine different sizes (from 6 to 80 nm in diameter) in a 4 × 4 μm2 field-of-view fabricated using top-down nanofabrication with a height of 2.5 nm (scale bar 1 μm). (c) Elemental contrast image in the PEEM at Fe L3 edge where each bright spot corresponds to an iron nanoparticle. (d) XAS spectra at Fe L3 edge during different stages of annealing of a selected single 60 nm particle and obtaining pure iron by in-situ temperature-controlled reduction of surface oxide. (e) Evolution of XAS spectra of the 60 nm particle at different intervals of oxidation at 1 × 10⁻⁸ mbar. XAS spectra at Fe L3 edge of four different particle sizes (6, 10, 40, 80 nm) after (f) annealing at 450 °C where all the spectra are similar and resemble that of metallic iron, (g) after 5 minutes of oxygen dosage at 1 × 10⁻⁸ mbar showing largest extend of oxidation of the smaller nanoparticle.

