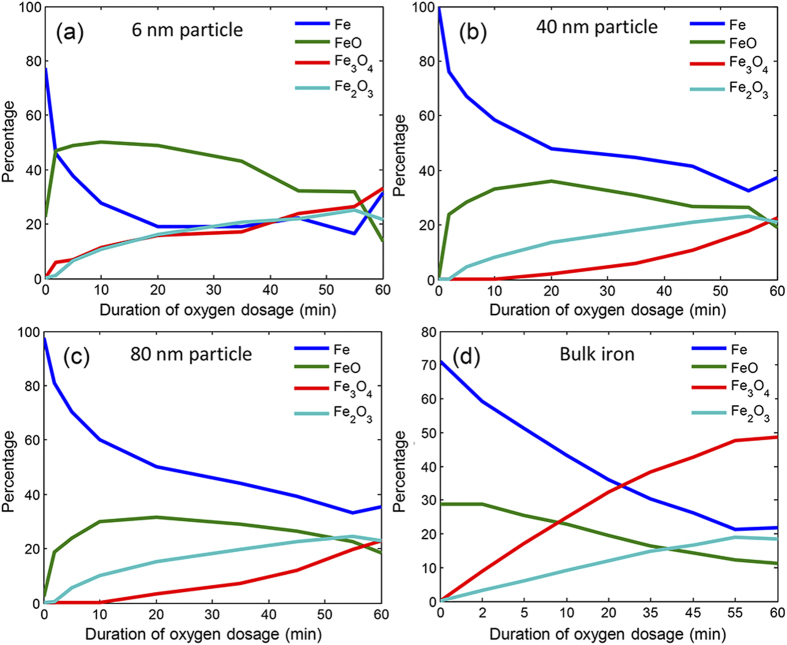
Figure 2. Change in concentration of Fe, FeO, Fe2O3, Fe3O4 during controlled oxygen dosage at 1 × 10⁻⁸ mbar over time observed for (a) iron particle with 6 nm diameter, (b) iron particle with 40 nm diameter, (c) iron particle with 80 nm diameter, and (d) bulk iron.
Iron in bulk shows a different mechanism of inter-conversion of oxides compared to the nanoparticles. In addition, the rate of reduction of iron and inter-conversion of different oxides differ considerably as size of iron nanoparticles vary.

