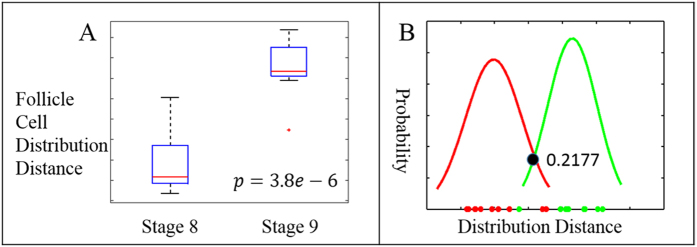
Figure 6. Analysis of follicle cell distribution distance between stage 8 and 9.
(A) Boxplot of follicle cell distribution distance of stage 8 and 9. Two-sample t–test gives significant value p < 0.000004. (B) Fitted Gaussian curves of follicle cell distribution distance for stage 8 (red) and 9 (green). The data pointed on the horizontal axis depicted all follicle cell distribution distances (∆-distance), the range of the ∆-distance is from 0.0184 to 0.4192. The Gaussian curves were fitted by using Gaussian distribution with computed sample mean and sample standard deviation. The cutoff to classify stage 8 from stage 9 was computed as the intercept of two fitted curves. The corresponding follicle cell distribution distance of this intercept point is 0.2177.

