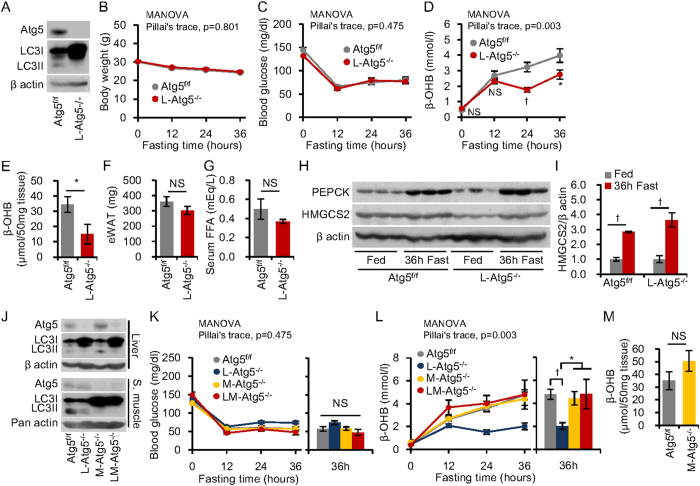
Figure 1. Starvation-induced gluconeogenesis and ketogenesis in liver- and muscle-specific Atg5−/− mice.
(A) Liver-specific autophagy-deficient mice (L- Atg5−/−) were generated by crossbreeding Atg5flox/flox (Atg5f/f) mice with albumin-Cre mice. Western blots for Atg5 and LC3II/LC3I proteins in liver tissues of mice fasted for 36 h. An absence of LC3II protein and increased LC3I protein indicate functional deletion of autophagy; β-actin was used as loading control. (B–D) Body weight (B), blood glucose (C), plasma β-hydroxybutyrate (β-OHB) levels (D) during 36 h fasting (n = 10 per group). (E) β-OHB concentrations in liver homogenates from Atg5f/f mice and L- Atg5−/− mice at 36 h fasting (n = 10 per group). (F) Weight of epigonadal white adipose tissue of Atg5f/f mice and L- Atg5−/− mice under ad libitum feeding. (G) Serum free fatty acid (FFA) levels in Atg5f/f mice and L- Atg5−/− mice after 36 h fasting (n = 5 per group). (H) Western blots for phosphoenolpyruvate carboxykinase (PEPCK) and HMG-CoA synthase 2 (HMGCS2) in liver tissue, with β-actin as loading control. (I) Quantitative analysis of the ratio of HMGCS2 to β-actin, with data represented as a fold-increase over levels in fed animals (n = 3 per group). (J) Skeletal muscle-specific autophagy-deficient mice (M-Atg5−/−) were generated by crossbreeding Atg5 f/f mice with Mlc-1f-Cre mice. L-Atg5−/− mice were generated as described above and LM-Atg5−/− are mice with the double knockout, in both liver and skeletal muscle. Western blots for Atg5 and LC3II/LC3I proteins in liver and skeletal muscle tissues after 36 h fasting indicated liver and skeletal muscle autophagy deficiency. β-actin and pan-actin were used as loading controls for the samples from liver and skeletal muscle, respectively. (K,L) Blood glucose (K) and β-OHB levels (L) during 36 h fasting (n = 12 for Atg5f/f, n = 10 for L-Atg5−/−, n = 5 for M-Atg5−/−, and n = 4 for LM-Atg5−/−). (M) β-OHB concentrations in skeletal muscle homogenates. Data are means ± SEM. *P < 0.05, †P < 0.01, NS indicates not statistically significant.

