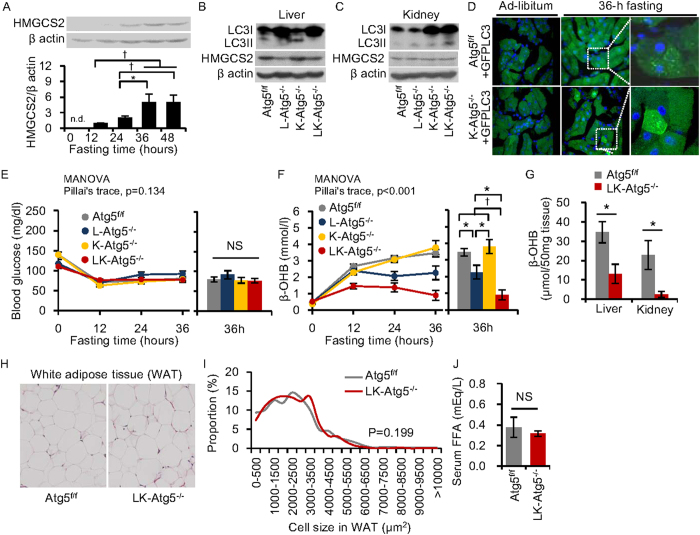
Figure 2. Starvation-induced gluconeogenesis and ketogenesis in liver- and kidney-specific Atg5−/− mice.
(A) Time-course analysis of HMG-CoA synthase 2 (HMGCS2) protein levels in kidney from Atg5f/f mice by western blotting. (B,C) Kidney proximal tubular cell-specific autophagy-deficient mice (K-Atg5−/−) were generated by crossbreeding Atg5f/f mice with Kap-Cre mice. L-Atg5−/− mice were generated as described for Fig. 1 and LK-Atg5−/− are mice with the double knockout, in both liver and kidney. Western blots for LC3II/LC3I proteins in liver and kidney tissues after 36 h fasting indicated liver and kidney autophagy deficiency. HMGCS2 expression levels of liver and kidney were also determined by western blots. (D) Kidney proximal tubular cells in K-Atg5−/− + GFP-LC3 mice and Atg5f/f + GFP-LC3 mice. Original magnification: 400×. (E,F) Blood glucose (E) and β-hydroxybutyrate (β-OHB) levels (F) during 36 h fasting (n = 21 for Atg5f/f, n = 9 for L-Atg5−/−, n = 8 for K-Atg5−/−, and n = 10 for LK-Atg5−/−). (G) β-OHB concentrations in liver and kidney homogenates from Atg5f/f and LK-Atg5−/− mice at 36 h fasting. (H) Representative pictures of haematoxylin and eosin stain of white adipose tissues in Atg5f/f and LK-Atg5−/− mice under ad-libitum feeding. Original magnification: 100×. (I) Proportion of cell size in white adipose tissue from Atg5f/f and LK-Atg5−/− mice under ad-libitum feeding. (J) Serum free fatty acid (FFA) levels in Atg5f/f mice and LK- Atg5−/− mice after 36 h fasting (n = 5, each). Data are means ± SEM. *P < 0.05, †P < 0.01, NS indicates not statistically significant.

