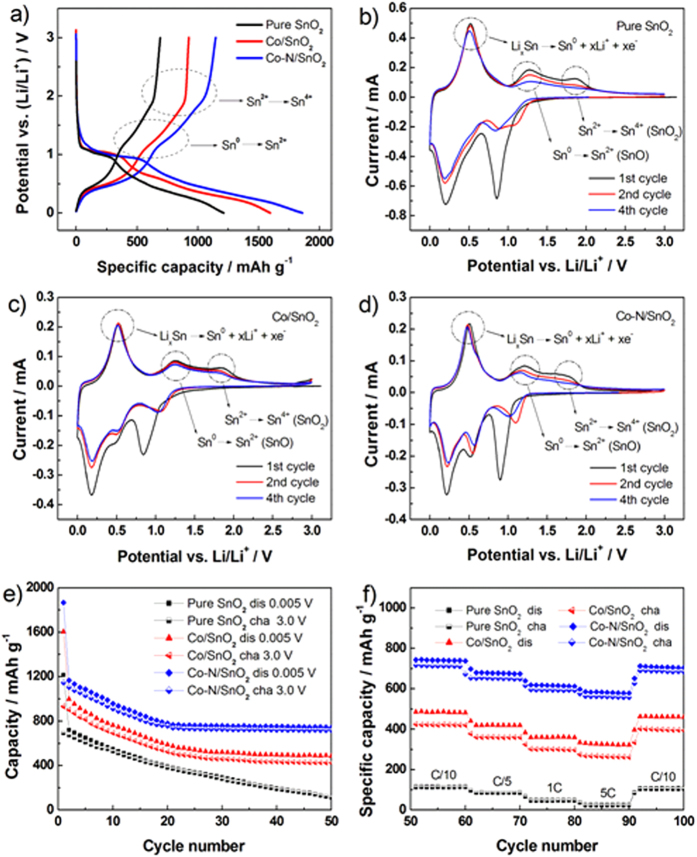
Figure 5. Comparison of electrochemical performances of the as-prepared samples.
(a) Charge-discharge curves for pure SnO2, Co/SnO2 and Co-N/SnO2/Li cycled between 3.0 and 0.005 V at a rate of 0.1 C (1 C = 782 mA g−1). CV curves of the pure SnO2 (b), Co/SnO2 (c) and Co-N/SnO2 (d) electrodes at a scanning rate of 0.10 mV s−1. Cycling performances at 0.1 C (e) and rate capabilities (f) of SnO2, Co/SnO2 and Co-N/SnO2 electrodes (“dis” and “cha” represent the states of discharge and charge upon cycling).

