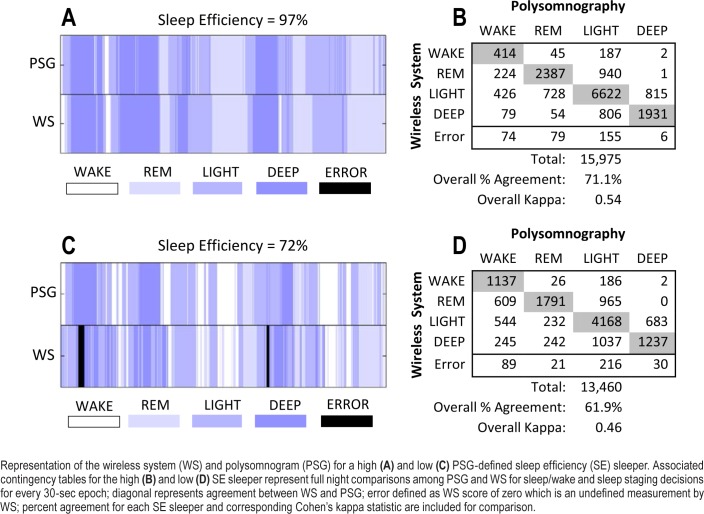
Figure 2. Representative subjects and associated contingency tables for sleep staging.
Representation of the wireless system (WS) and polysomnogram (PSG) for a high (A) and low (C) PSG-defined sleep efficiency (SE) sleeper. Associated contingency tables for the high (B) and low (D) SE sleeper represent full night comparisons among PSG and WS for sleep/wake and sleep staging decisions for every 30-sec epoch; diagonal represents agreement between WS and PSG; error defined as WS score of zero which is an undefined measurement by WS; percent agreement for each SE sleeper and corresponding Cohen's kappa statistic are included for comparison.

