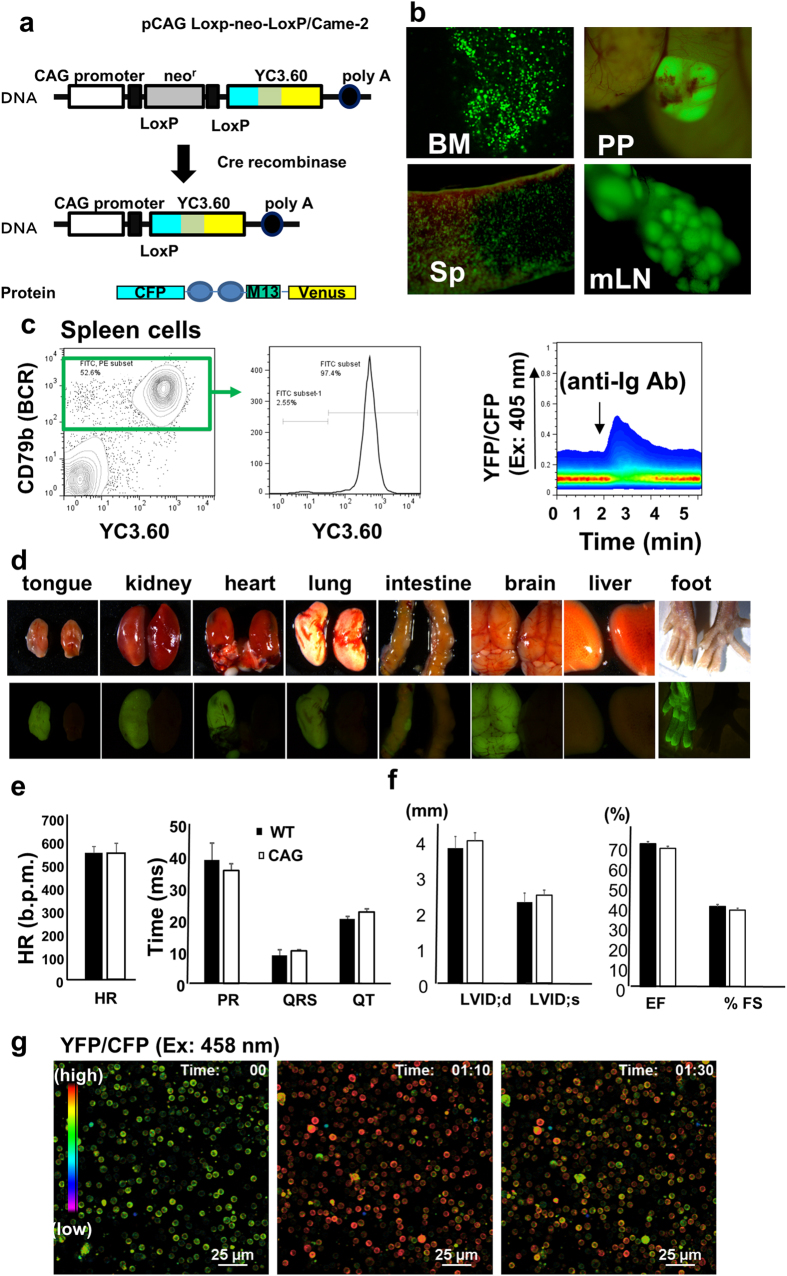
Figure 1. Characterization of YC3.60flox/CD19-Cre and YC3.60flox/CAG-Cre mice.
(a) Schematic diagram of the conditional YC3.60 expression construct. (b) Representative images of YC3.60flox/CD19-Cre mouse lymphoid tissue. Peyer’s patches (PP), bone marrow (BM), mesenteric lymph node (mLN), and spleen (Sp) were analyzed by fluorescent microscopy (n = 3 mice). YC3.60-expressing cells are shown in green. (c) BCR-mediated Ca2+ mobilization in splenic B cells. Splenic cells were prepared from YC3.60flox/CD19-Cre mice. Percentages in Igβ+ cells are shown (middle panel). Ca2+ mobilization was determined by flow cytometry based on YC3.60 FRET. An anti-Igβ monoclonal antibody (mAb) (HM79) was added to the splenic cells at the indicated time point. Results are representative of at least five independent experiments (n > 5 mice). (d) YC3.60 expression in organs of CAG-Cre/YC3.60 mice. Bright-field and fluorescent images of isolated organs from CAG-Cre/YC3.60 (left) mice and wild-type (right) mice are shown. (e) ECG analysis of ubiquitous YC3.60 expression mice. Heart rates (left) and ECG parameters (right) are shown. (f ) UCG analysis of CAG-Cre/YC3.60flox expression mice. UCG parameters are shown. (e and f) CAG-Cre/YC3.60 (n = 3 mice) and wild-type (n = 5 mice) are indicated by open and hatched bars, respectively. Mean and SD are shown. No significant differences were noted in any parameters (P > 0.05). (g) Ionomycin-induced Ca2+ fluxes in splenic cells from the ubiquitous YC3.60 expression mouse. Ionomycin (final concentration 5 μmol/L) was added in splenic cell culture 50 s after starting observation. Representative ratiometric images (YFP/CFP at excitation of 458 nm) are shown that were obtained using confocal microscopy. Scale bar, 25 μm. Frame = 64.

