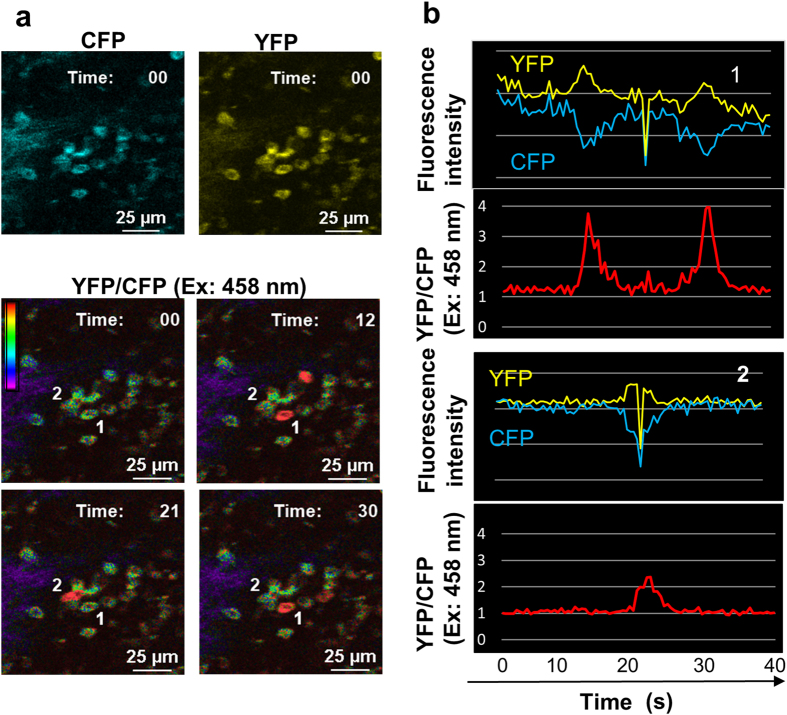
Figure 2. Intravital Ca2+ signaling images in the spleen of a YC3.60flox/CD19-Cre mouse.
(a) Representative Ca2+ signaling images in the spleen of a YC3.60flox/CD19-Cre mouse are shown. A rainbow parameter indicates relative Ca2+ concentration. (b) Time courses for fluorescence intensities of CFP and YFP (Venus) and the YFP/CFP ratio at excitation of 458 nm in indicated cells in (a) are shown. Scale bar, 25 μm. Frame = 80.

