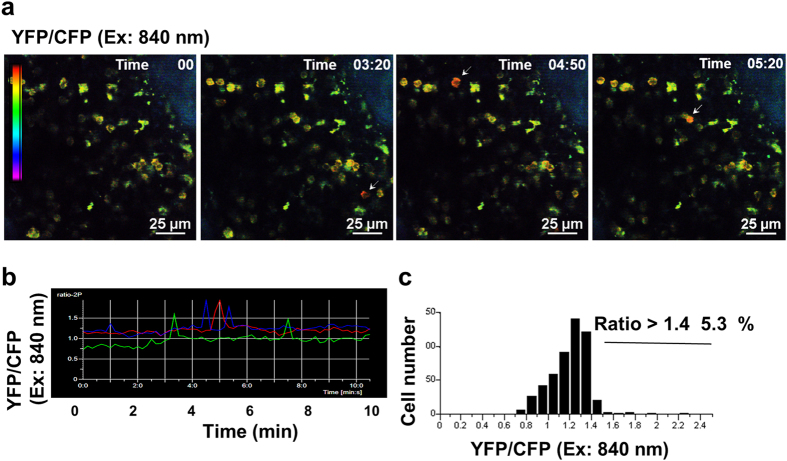
Figure 4. Representative Ca2+ signaling images in the bone marrow of a YC3.60flox/CD19-Cre mouse.
(a) Representative Ca2+ signaling image in the bone marrow of a YC3.60flox/CD19-Cre mouse. Intravital imaging of the bone marrow was performed using two-photon microscopy. Only ratiometric images (YFP/CFP at excitation of 840 nm) are shown. Cells exhibiting FRET signals are indicated by arrows. Results are representative of three independent experiments (n = 3 mice). Scale bar, 25 μm. (b) Time course of intracellular Ca2+ fluxes. Ratiometric intensities (YFP/CFP at excitation of 840 nm) of indicated cells in (a) were measured for 10 min at 10 s intervals. (c) Distribution of time-integrated intracellular Ca2+ concentrations of B cells. n = 50, frame = 61.

