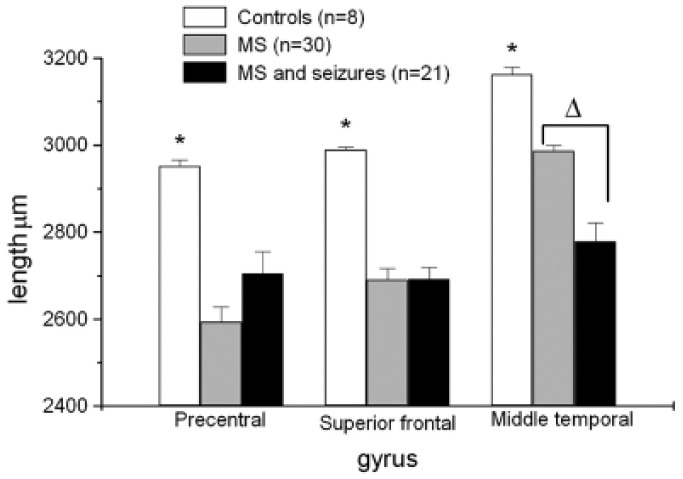
Figure 2.

Individuals with MS and seizures (n = 21) were compared to controls (n = 8) and MS alone (n = 30). There were significant reductions in cortical thickness of all gyri in patients with MS compared to controls (mean ± SE).
*p < 0.0015). Compared to patients with MS alone there was a significant reduction in cortical thickness in individuals with MS and seizures in the middle temporal gyrus (Δp < 0.00003).
