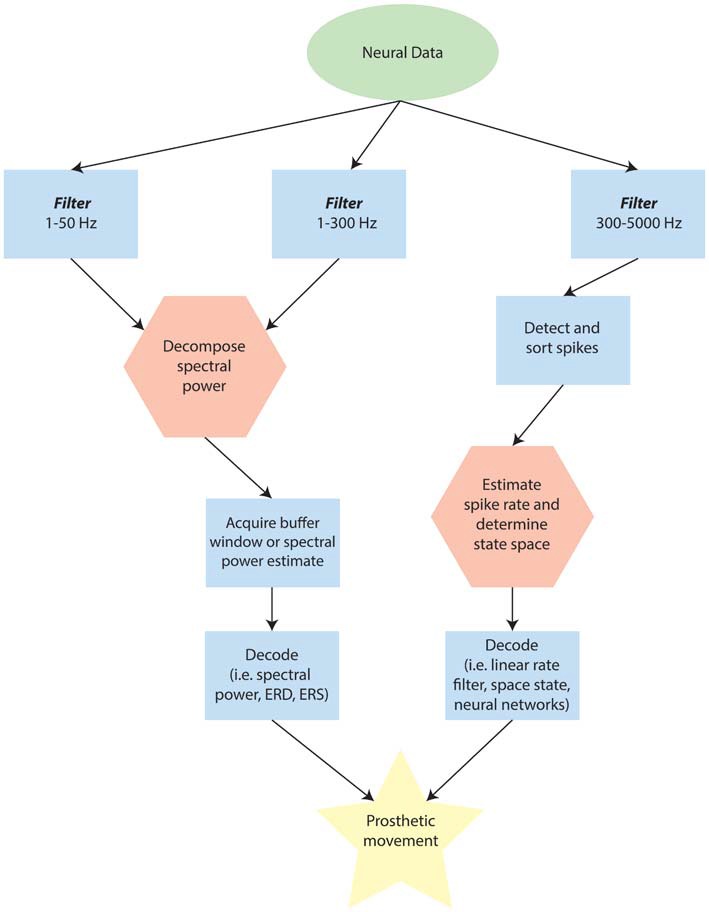
Figure 2.

Schematic of possible differences in analysing point-processes and waveforms when using externally interfaced motor prosthetics. Note that this flow may change depending on the specific device, but is designed to provide a broad overview for comparison. In the diagram, the green ellipse represents data that has been recorded and amplified from the neural source. Blue rectangles are stages along the processing pathway that are typical for many devices. Red hexagons represent potential rate-limiting steps in determining the latency of the Brain Computer Interface (BCI) response to immediate internal changes in patterns of neural activity.
