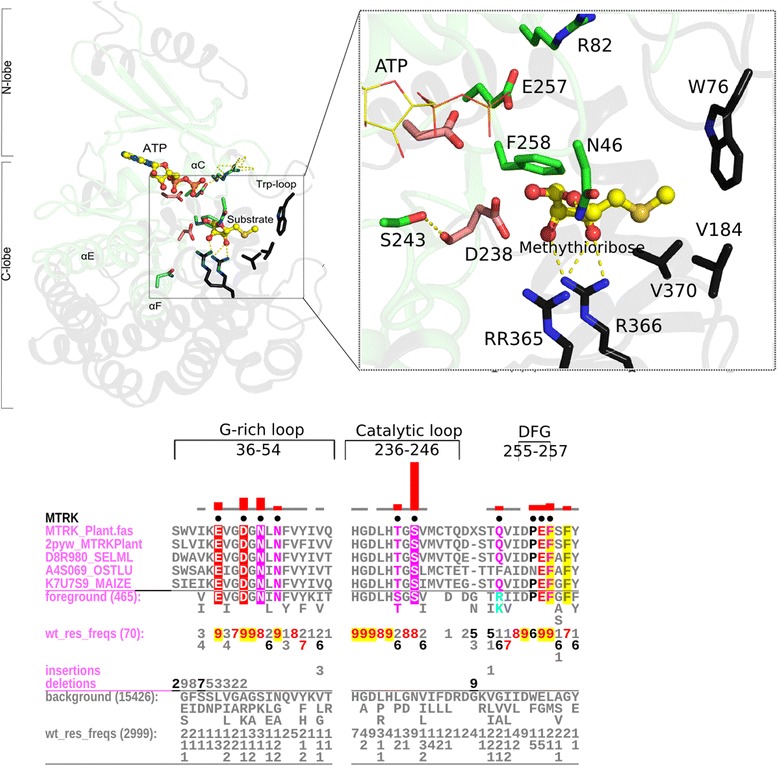
Fig. 5.

The substrate recognition region in MTRK. The top panel shows the structural context and an inset showing the details of the substrate binding region in a plant MTRK. In the structure figures, the green regions correspond to the core domain whereas the black regions are outside of the core. Residues that are MTRK specific are shown with green carbon atoms and catalytic residues are shown in light pink carbon atoms. Important residues in the non-core region that bind substrate are shown in black. A non-core insert part of the substrate binding ‘trp-loop’ (containing W76) is also shown in context of the substrate. The mcBPPS pattern characteristic of MTRK is shown using CHA. CHA shows representative bacterial MTRKs as the display alignment, all MTRK sequences (465 sequences) as the foreground alignment and other ELK sequences (15,426) as the background. CHA coloring scheme and representation is similar to that described in Fig. 3d
