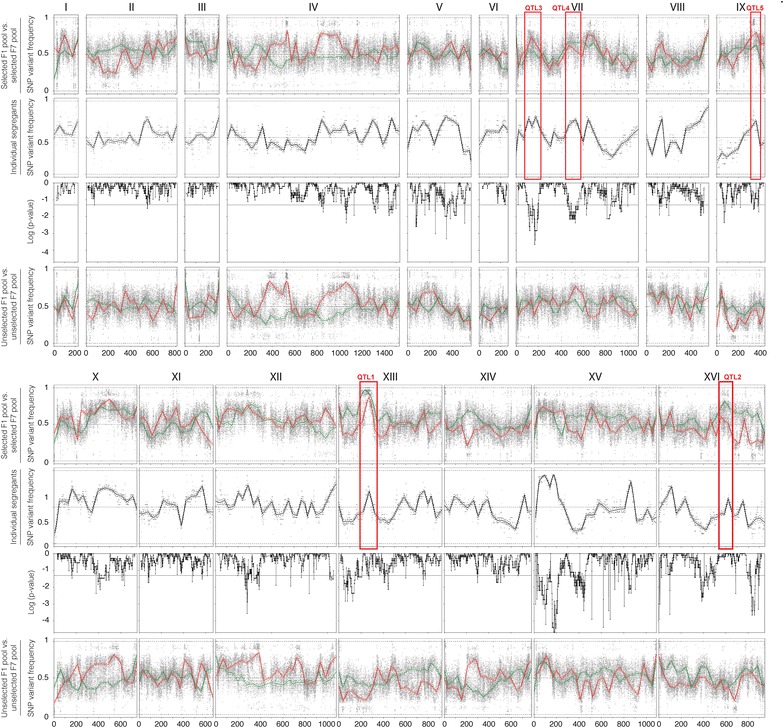
Fig. 2.

QTL mapping of high acetic acid tolerance. The mapping was performed with pooled F1 segregants (green), pooled F7 segregants (red), and individual F7 segregants (black, second row). Pooled F1 and pooled F7 segregants (27 segregants for both pools) were subjected to sequence analysis with the Illumina platform at BGI. Individual F7 segregants were sequenced with the Illumina platform at EMBL. P values calculated using the individual sequencing data from F7 segregants were plotted against the respective chromosomal position (third row). p values <0.05 (indicated by dotted line) were considered statistically significant. Unselected pools consisting of 27 randomly selected segregants were also sequenced to eliminate linkage to inadvertently selected traits (bottom row, F1 segregants: green, F7 segregants: red)
