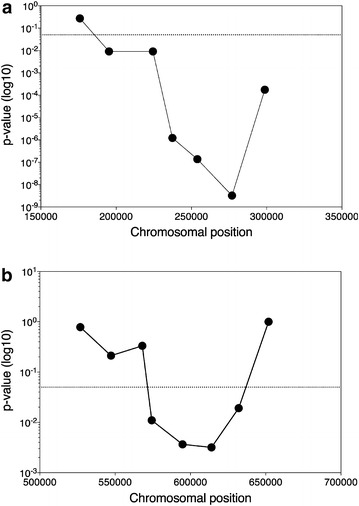
Fig. 3.

QTL mapping with selected SNPs in the individual segregants. Selected SNPs in QTL1 (a) and QTL2 (b) were scored with allele-specific PCR, the SNP variant frequency and the corresponding p values were calculated, and the p values were plotted over the length of the chromosomes, XIII for QTL1 (a) and XVI for QTL2 (b)
