
Fig. 2.
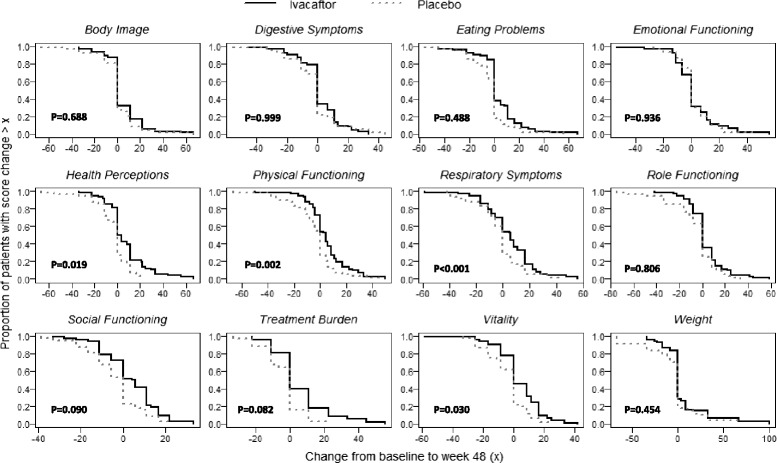
Cumulative response curves for CFQ-R scales by treatment group. P-values from the Kolmogorov-Smirnov two-sample test for equality of cumulative distribution functions
Official websites use .gov
A
.gov website belongs to an official
government organization in the United States.
Secure .gov websites use HTTPS
A lock (
) or https:// means you've safely
connected to the .gov website. Share sensitive
information only on official, secure websites.
Cumulative response curves for CFQ-R scales by treatment group. P-values from the Kolmogorov-Smirnov two-sample test for equality of cumulative distribution functions