Fig. 3.

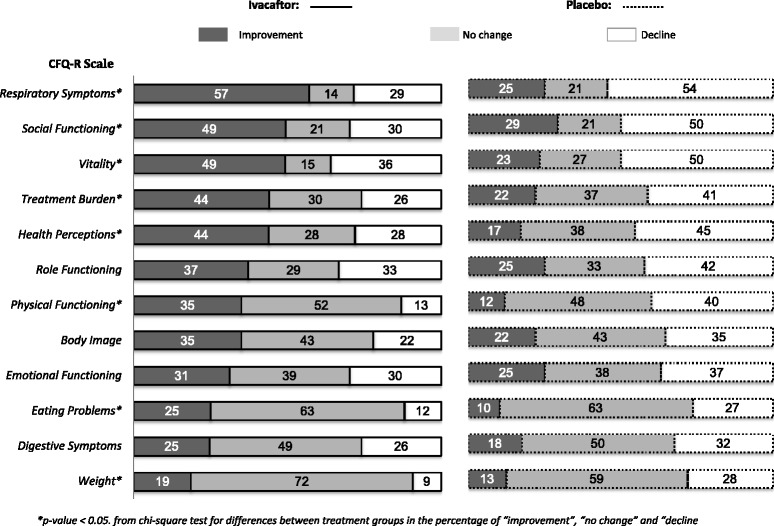
Analysis of categorical change from baseline to week 48 by CFQ-R scale and treatment group. *p-value < 0.05. from chi-square test for differences between treatment groups in the percentage of “improvement”, “no change” and “decline” patients

Analysis of categorical change from baseline to week 48 by CFQ-R scale and treatment group. *p-value < 0.05. from chi-square test for differences between treatment groups in the percentage of “improvement”, “no change” and “decline” patients