
Fig. 1.
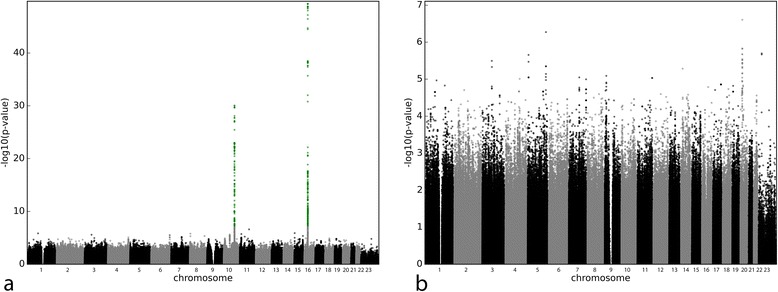
Manhattan plots for multiple regressions on MWD only adjusting for non-genetic factors (a) and adjusting for non-genetic and genetic factors (b). The vertical axis represents the common logarithm of the P value, numbers on the horizontal axis represent the chromosome. Signals below the genome-wide significance threshold of 5 × 10−08 are represented in green