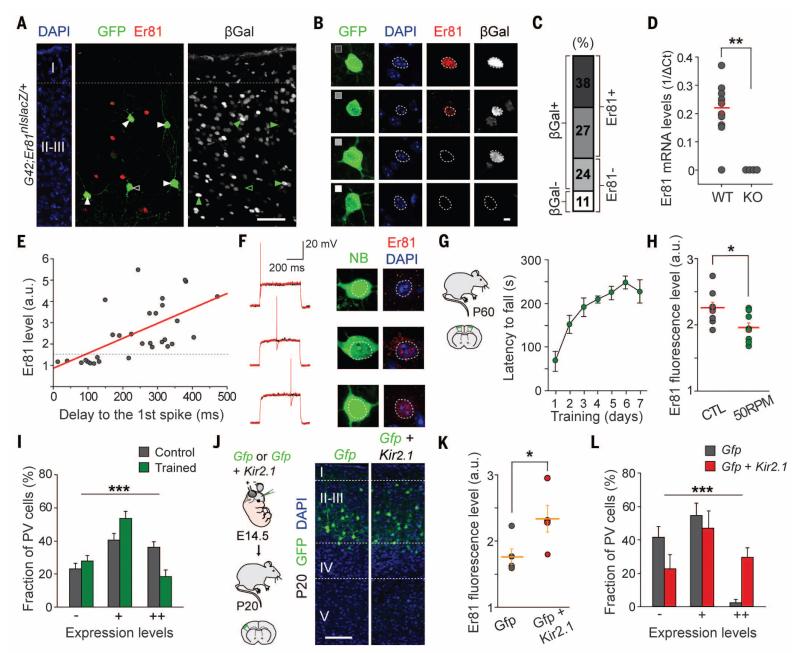
Fig. 4. Activity-dependent changes in Er81 expression.
(A) Expression of Er81 and beta-galactosidase (βGal) in layer II-III PV+ interneurons. (B and C) Representative examples and relative proportion of four groups of layer II-III PV+ interneurons based on Er81 and βGal expression. (D) Most PV+ interneurons contain significant Er81 mRNA levels. (E) Scatter plot of Er81 expression and latency to the first spike. Line, linear regression fit (R2) = 0.63 (P < 0.0001). (F) Representative traces of recorded PV+ interneurons illustrating the positive correlation between delayed firing and Er81 expression. (G) Learning curve (RotaRod performance) for motor task. (H) Er81 fluorescence intensity levels in PV+ interneurons from control and trained animals (n = 8; P < 0.05). (I) Distribution of Er81 fluorescence intensities in layer II PV+ interneurons from control and trained mice (n = 8; P < 0.001). Cells were grouped into three main classes on the basis of their levels of fluorescence intensity for nuclear Er81, < 1.3 times background levels (−), 1.3 to 1.6 times background (+), and > 1.6 times background levels (++). (J) Experimental design and distribution of electroporated pyramidal cells in layer II-III. (K) Mean Er81 fluorescence intensity in PV+ interneurons from control and Kir2.1-electroporated mice (n = 4; P < 0.01). (L) Distribution of Er81 fluorescence intensities in layer III PV+ interneurons from control and Kir2.1-electroporated mice (n = 4; P < 0.001), groups as in (I). Scale bars, 50 μm (A), 5 μm (B), and 100 μm (J). Graphs represent means ± SEM.

