
Fig. 2.
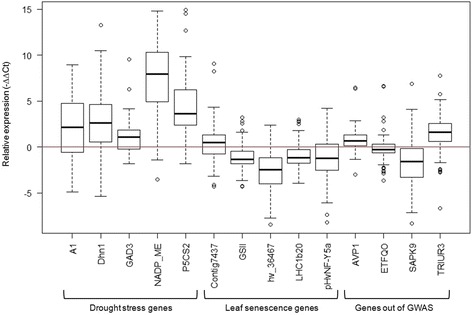
Expression profile for drought stress and leaf senescence genes. Relative Expression (-∆∆Ct) for the selected genes at 26 days after sowing (das) shown in box whisker plots including all 156 analysed barley genotypes
Official websites use .gov
A
.gov website belongs to an official
government organization in the United States.
Secure .gov websites use HTTPS
A lock (
) or https:// means you've safely
connected to the .gov website. Share sensitive
information only on official, secure websites.
Expression profile for drought stress and leaf senescence genes. Relative Expression (-∆∆Ct) for the selected genes at 26 days after sowing (das) shown in box whisker plots including all 156 analysed barley genotypes