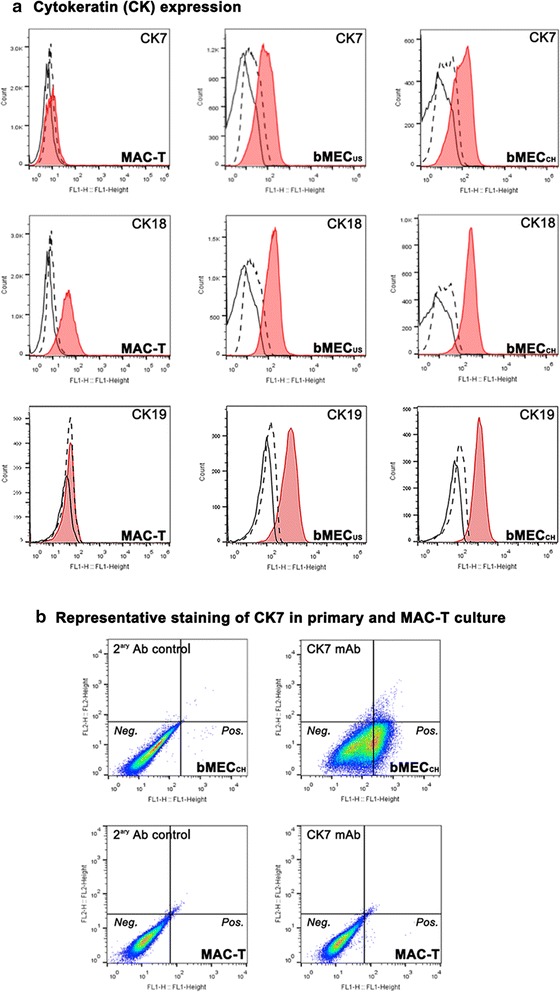
Fig. 3.

Flow cytometry of selected markers of epithelial cells in bovine primary and immortalized cell cultures. The cell populations are identical to the ones shown in Fig. 2a. a. The cell staining for cytokeratin (CK) 7, CK18 and CK19 in MAC-T, bMECUS and bMECCH cultures, respectively, is shown in red. b. Distribution of CK7 positive cells in bMECCH and MAC-T cultures. The X-axis (FL1-Height channel) detects FITC-tagged antibody, while Y-axis (FL2-Height) detects Cy3-tagged antibody. All other details are as described in Fig. 2
