Fig. 2.

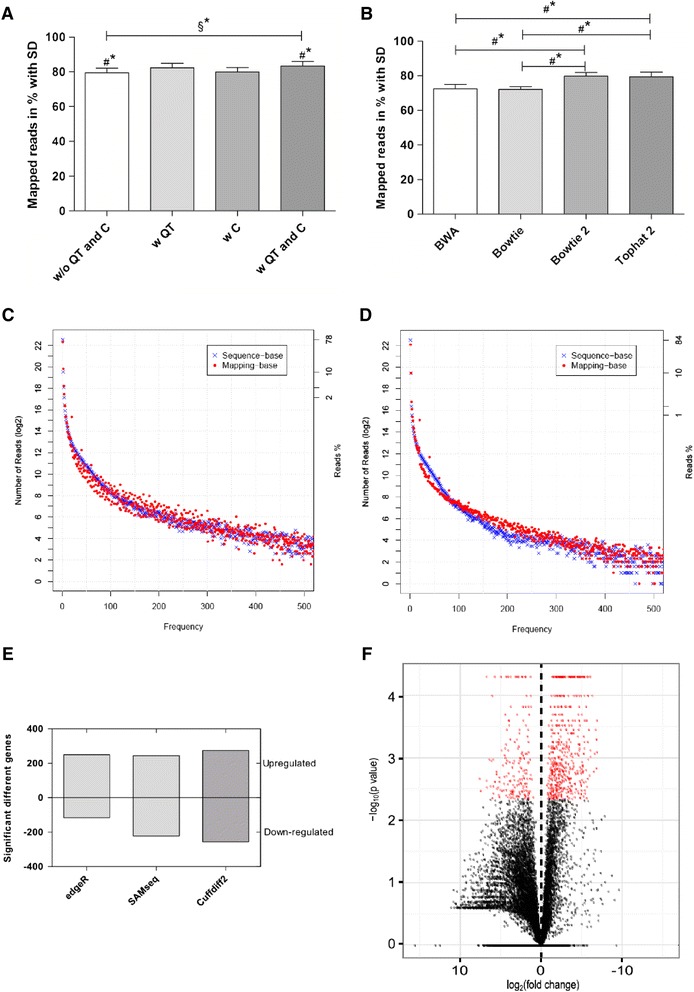
Evaluating the different analyses modules of TRAPLINE. a A fraction of mapped reads with and without applying pre-processing modules (QT: quality trimming; C: clipping). TopHat2 was used for genome mapping. Error bars indicate the standard deviation. Asterisks indicate a significant difference: # Welch’s t-test with α = 0.05; § ANOVA with α = 0.05; (n = 6). b Comparison of different genome mapping tools. The bars indicate the transcript accuracy of the reads aligned to the genome in %, including the standard deviation. Marks indicate significant difference: # Welch’s t-test with α = 0.05, Bonferroni test with α = 0.05; (n = 6). c and d Comparison of read correction procedure by Picard Toolkit, before (c) and after (d), to visualize and correct for multiple RNA sequences in the experimental datasets. RSeQC shows the two specific read duplication correction possibilities: "Sequence-base" reads have the same nucleotide sequence (blue), "Mapping-base" reads have the same mapped sequence, but are aligned to different locations on the genome (red). e Comparison of three different DE analysis tools (edgeR, SAMseq and Cuffdiff2), after read mapping with Bowtie (edgeR, SAMseq) TopHat2 (Cuffdiff2). The total number of significantly differentially expressed genes is based on FDR < 0.05 and divided into upregulated and downregulated genes. f Vulcano plot illustrating significantly differentially expressed genes (red dots: FC≥2; p≤0.05)
