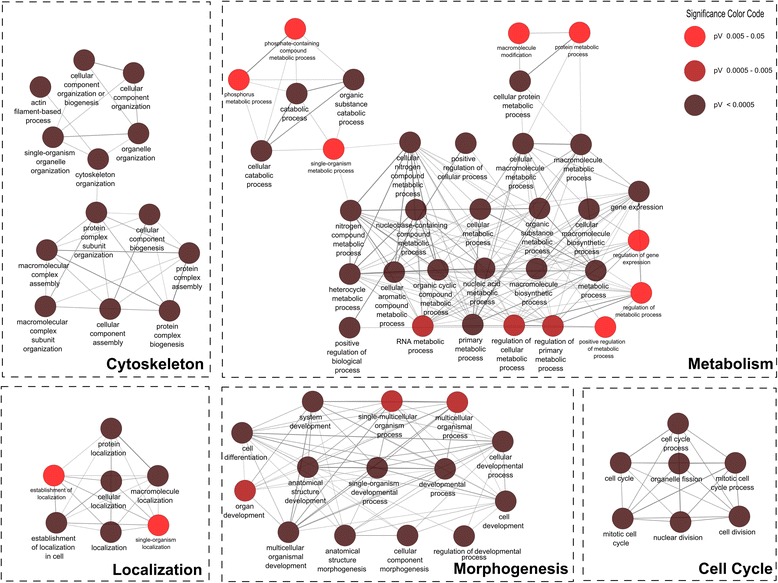
Fig. 3.

ClueGo visualization of a gene ontology interaction network obtained after functional classification analysis with DAVID. The network shows interconnections among different biological processes of 350 enriched significantly upregulated genes. Subnetworks are grouped based on GO superclasses (bold label). The colors range from red (less significant; pV = 0.05) to brown (highly significant; pV ≤ 0.05*10−3)
