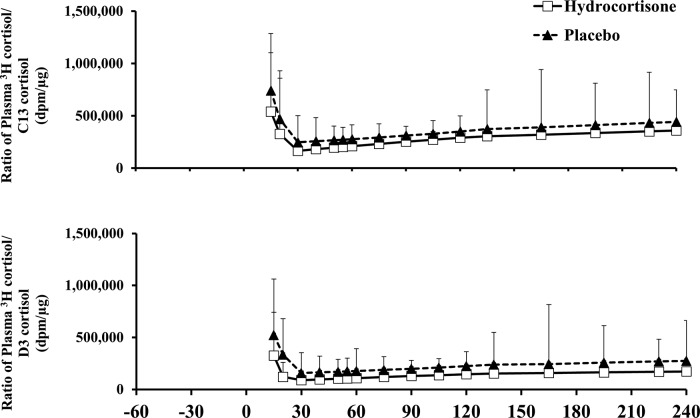
Figure 3.
Ratios of plasma 3H cortisol/C13 cortisol and plasma 3H cortisol/D cortisol concentrations observed with the triple tracer cortisol technique in hydrocortisone (white rectangles) and placebo (black triangle) groups. A total of 1.0 mg of [4-13C] cortisone and 1.0 mg of D cortisol were ingested at time 0.

