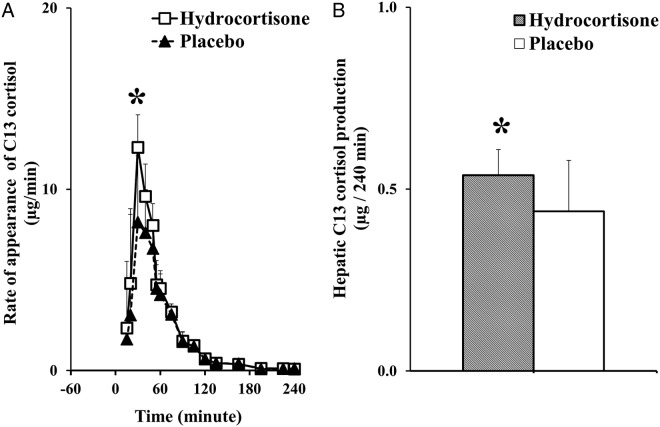
Figure 4.
Systemic rates of appearance of C13 cortisol (derived from ingested 13C cortisone) (A) calculated using Steele's steady-state equation in hydrocortisone (white rectangles) and placebo (black triangles) groups following the ingestion of 1.0 mg of 13C cortisone at time 0. *P = .02 vs placebo group. Hepatic C13 cortisol production (B) in hydrocortisone (shaded bars) and placebo (white bars) groups over 240 minutes following the ingestion of 1.0 mg of 13C cortisone at time 0. *P = .02 vs placebo group.

