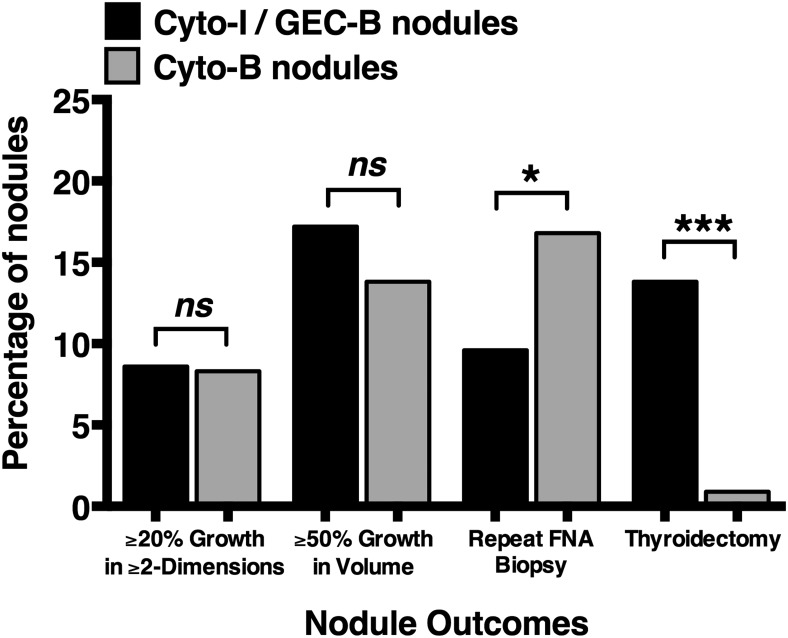
Figure 1.
Nodule growth and outcomes for cytologically indeterminate/GEC benign nodules compared to cytologically benign nodules. Bar graphs representing the percentage of nodules meeting prespecified endpoints for 58 cytologically indeterminate and Afirma GEC benign (Cyto-I/GEC-B) nodules (black bars) compared with 1224 cytologically benign (Cyto-B) nodules (gray bars). Nodule growth of 20% or greater in two or more nodule dimensions and 50% or greater in nodule volume for these two groups was 8.6% vs 8.3% (P = .80) and 17.2% vs 13.8% (P = .44), respectively. Repeat assessment by FNA biopsy and thyroidectomy, for Cyto-I/GEC-B and Cyto-B nodule groups, occurred in 6.9% vs 16.8% (P = .05) and 13.8% vs 0.9% (P < .0001), respectively. Volume was defined as by ellipsoid formula (volume = length × width × depth × π/6). ns, not significant. *, P < .05; ***, P < .0001.

