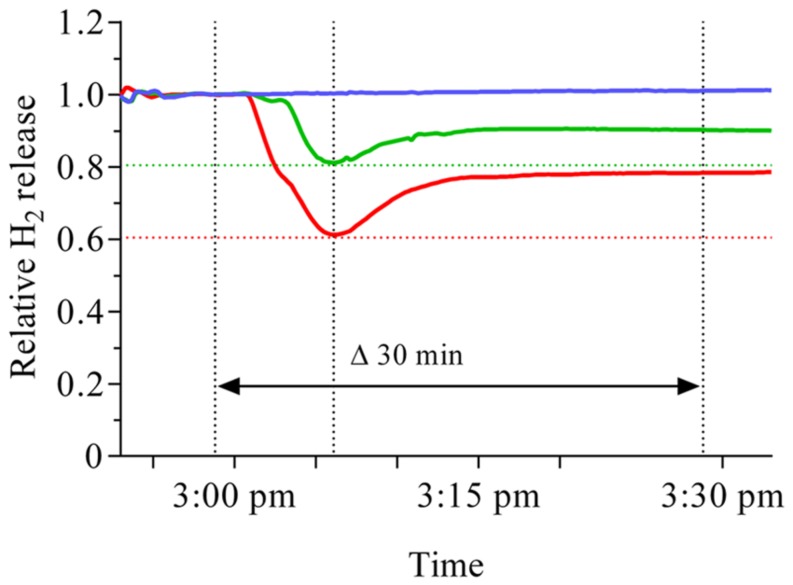
FIGURE 1.
Time course of nodule H2 evolution before and after an increase in external oxygen concentration around M. truncatula nodules. Data were taken every 12 s for a time period of about 45 min, including 30 min after the increase in external oxygen concentration. The blue line represents the untreated control, while the external oxygen concentration represented by the green or red line was increased from 21% to 25 or 30% respectively. The increase was implemented at 2:58 pm, indicated by the dotted line. A steep decline started about 4 min after increasing the external oxygen concentration and leveled off after 10 min (second dotted line from the left), irrespective of the extent of the increase in oxygen concentration. A subsequent recovery reached a more or less constant new level about 15 min after the change in external oxygen concentration. The extent of the initial decline is indicated by the red and green dotted lines.

