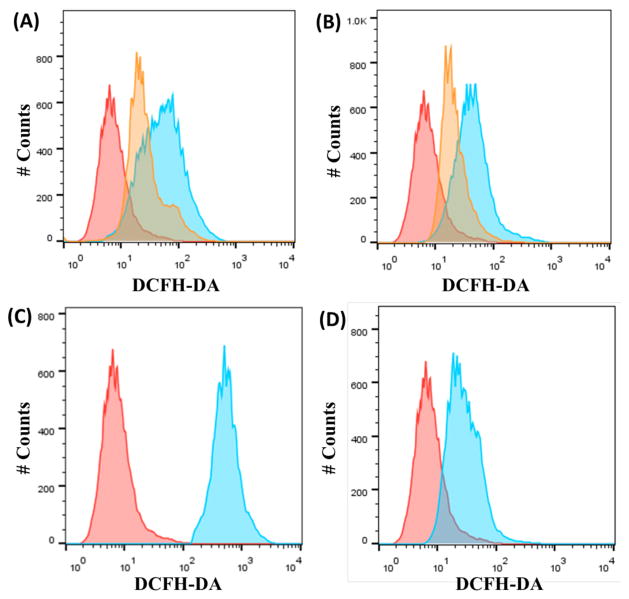
Figure 3.
(A) Representative histograms displaying the green fluorescence emitted by DCFH-DA stained A549 cells (red) and A549 cells treated with 1 (20 μM for 12 h) (blue) or 1 (20 μM for 12 h) with nectrostatin-1 (60 μM for 12 h) (orange). (B) Representative histograms displaying the green fluorescence emitted by DCFH-DA stained A549 cells (red) and A549 cells treated with 2 (20 μM for 12 h) (blue) or 2 (20 μM for 12 h) with nectrostatin-1 (60 μM for 12 h) (orange). (C) Representative histograms displaying the green fluorescence emitted by DCFH-DA stained A549 cells (red) and A549 cells treated with H2O2 (1 mM for 1 h) (blue). (D) Representative histograms displaying the green fluorescence emitted by DCFH-DA stained A549 cells (red) and A549 cells treated with shikonin (20 μM for 12 h) (blue).

