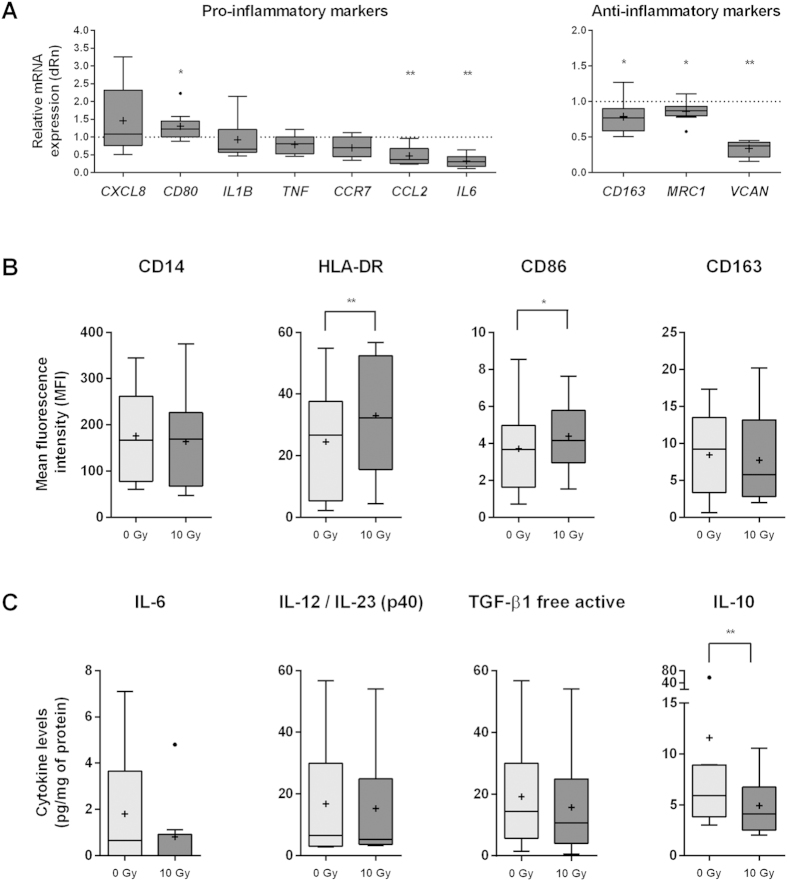
Figure 3. Irradiated macrophages present a reduced anti-inflammatory phenotype.
(A) mRNA expression profile of pro-(CXCL8, CD80, IL1B, TNF, CCR7, CCL2, IL6) and anti-inflammatory (CD163, MRC1, VCAN) macrophage markers, by real-time PCR, 20 h after 10 Gy. Graphs represent mRNA expression of irradiated macrophages compared to non-irradiated ones (dotted line) (at least n = 7 per marker). β-actin was used as housekeeping gene. Wilcoxon signed rank test was used to compare the median of each dataset against a hypothetical median value of 1. (B) Expression of a monocyte/macrophage lineage (CD14), pro-(HLA-DR and CD86) and anti-inflammatory (CD163) macrophage markers was determined, by flow cytometry, 20 h after irradiation (at least n = 6 per marker). Paired t-test was used for statistical analysis. (C) Levels of pro-(IL-6, IL-12/IL-23(p40)) and anti-inflammatory (TGF-β1 and IL-10) cytokines were determined in macrophage CM (n = 9) by ELISA, 20 h after irradiation. Data was normalized to protein concentration. Wilcoxon matched pair test was used for statistical analysis. *P < 0.05, **P < 0.01. Median is represented by the horizontal line inside the box plots, while the average is indicated by a “+”. In IL-6 and IL-10 graphics outliers are also indicated.

