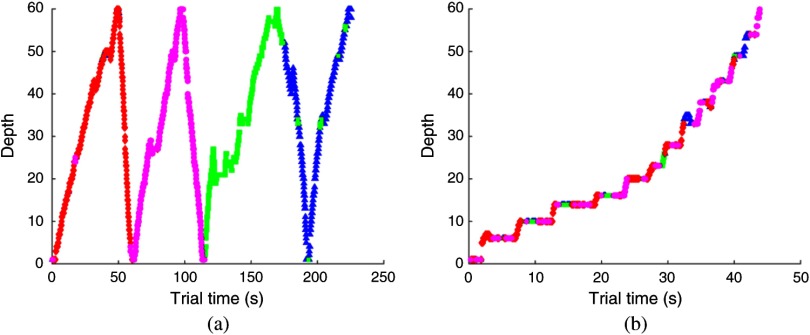
Fig. 2.
Example depth-time plots of observers’ eye positions. The four colors indicate four quadrants of the slice. (a) Drillers focused on one quadrant at a time, and they had multiple runs of scrolling in both forward and backward viewing directions to cover all the quadrants. (b) Scanners went over multiple quadrants before they moved to the next slice.

