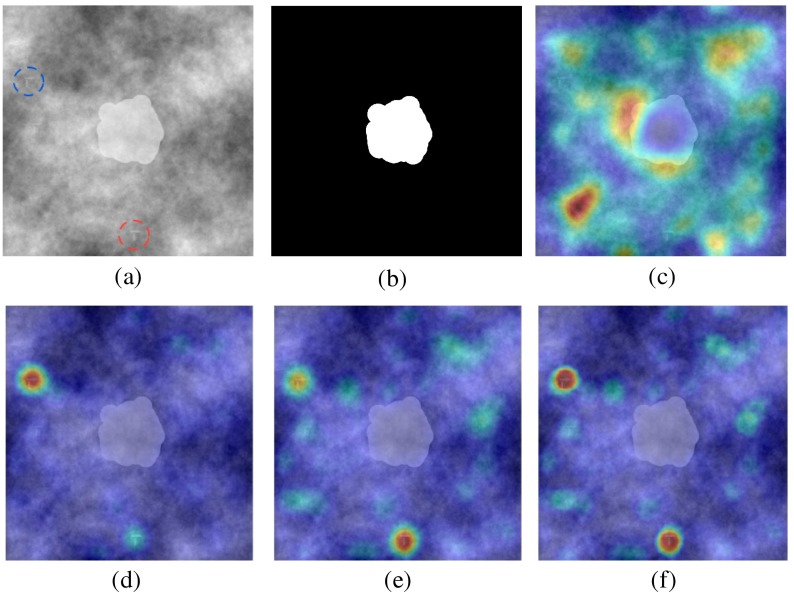
Fig. 3.
Example stimulus slice, and calculated 2-D saliency maps and dynamic saliency maps, overlapped upon the slice. Saliency maps are represented as heat maps, and the color indicates the saliency value at that location: red is more salient than blue. (a) The stimuli with one target T (red dashed circle) and one distractor L (blue dashed circle). (b) Heart segmentation: any position within the mask was excluded from being salient. (c) 2-D saliency map: neither T or L is salient. (d) Forward dynamic saliency map: L is salient while T is not salient. (e) Backward dynamic saliency map: T is salient while L is not. (f) Fused dynamic saliency map: both T and L are salient. (d) and (e) An example that the two directions of scrolling may provide different dynamic information when observers go back and forth through the volume in depth. (c) The 2-D saliency map did not do well in identifying objects of interest for this particular example.

