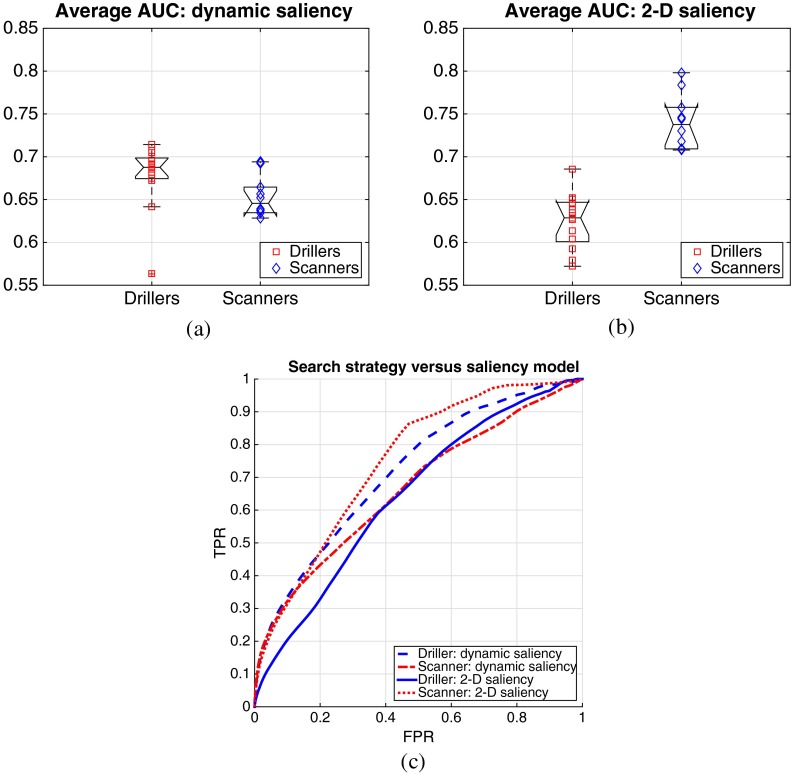
Fig. 4.
AUC scores on predicting fixations for 13 drillers (red squares) and 10 scanners (blue diamonds) using (a) the dynamic saliency map and (b) the 2-D saliency map, and (c) summary ROC curves. In (a) with the dynamic saliency map, most of the AUCs for the drillers are located at higher positions of the plot than the AUCs for the scanners, which suggests that drillers may have used more dynamic information than scanners did. In (b) with the 2-D saliency map, all the AUCs for the scanners are located at higher positions of the plot than the AUCs for the drillers, which suggests that scanners may have used more 2-D information than drillers. Summary ROC curves in (c) show the interactions between the two search strategies and the two saliency models. For the drillers, the ROC curve with the dynamic saliency (i.e., blue-dashed line) is above the ROC curve with the 2-D saliency (blue solid line). For the scanners, the ROC curve with the 2-D saliency (i.e., red-dotted line) is above the ROC curve (i.e., red dash-dotted line) with the dynamic saliency.

