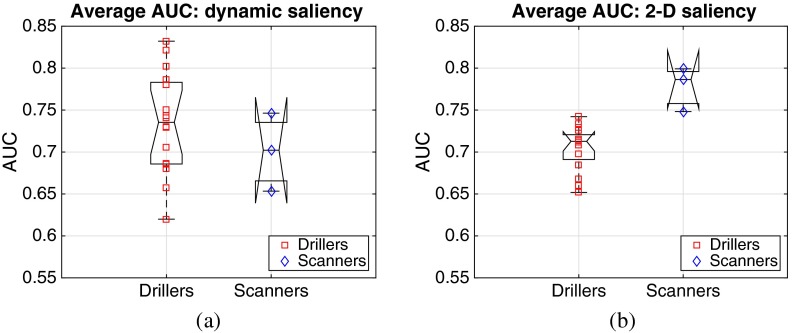
Fig. 6.
AUC scores on predicting fixations for 16 drillers (red squares) and 3 scanners (blue diamonds) using the dynamic saliency map (a) and the 2-D saliency map (b). In (a) with the dynamic saliency map, most of the AUCs for the drillers are located at higher positions of the plot than the AUCs for the scanners, which suggests that drillers may have used more dynamic information than scanners did. In (b) with the 2-D saliency map, all the AUCs for the scanners are located at higher positions of the plot than the AUCs for the drillers, which suggests that scanners may have used more 2-D information than drillers.

