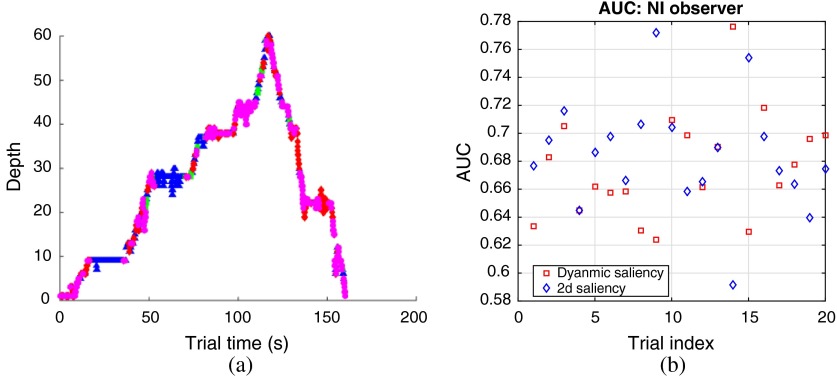
Fig. 7.
(a) Example depth-time plots of NI observers’ eye positions. The four colors indicate four quadrants of the slice. (b) Example AUCs achieved by the dynamic saliency maps (red squares) and the 2-D saliency maps (blue diamonds) in experimental trials, for predicting an NI’s fixations. NI observers tend to use a mix of drilling and scanning search strategy, and their search behavior varied on a trial-by-trial basis.

