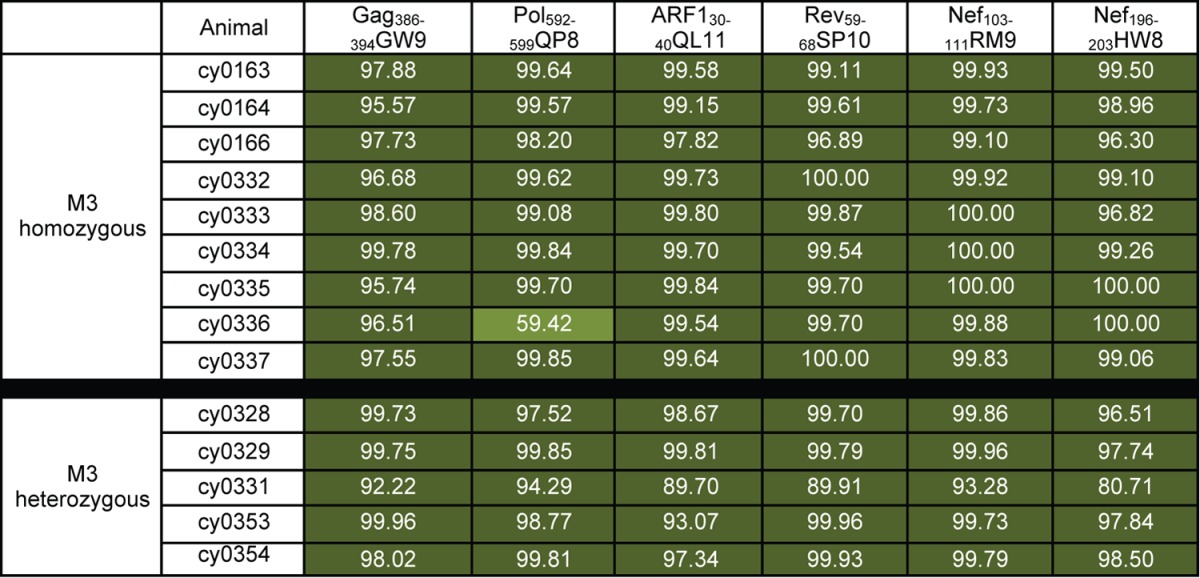
TABLE 4.
Percentage of category A epitopes with amino acid variation in M3-homozygous and -heterozygous MCMs

Amino acid variation was calculated as described in Materials and Methods. Values are percentages of variant sequences. Dark green, >75% variant; medium green, 50% to 75% variant.
