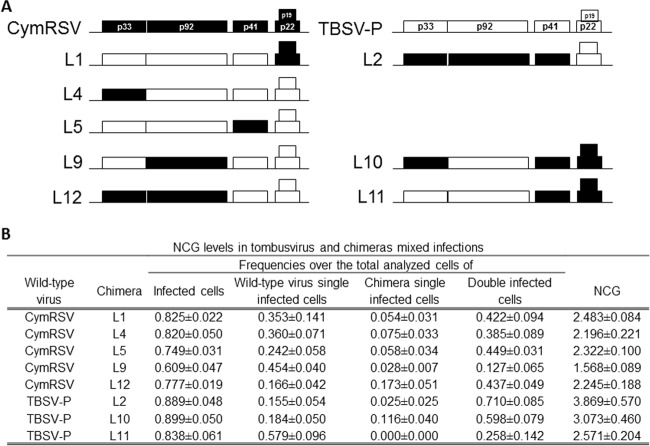
FIG 2.
Schematic representation of chimeras between TBSV-P and CymRSV and the NCG in various coinfections. (A) Chimeras coinoculated with CymRSV or with TBSV-P are shown, with ORFs derived from TBSV-P indicated as white boxes and ORFs derived from CymRSV indicated as black boxes. (B) Frequencies of total infected cells, doubly infected cells, and the NCG for each coinfection. The values are means ± standard errors of the results of three replicate experiments.

