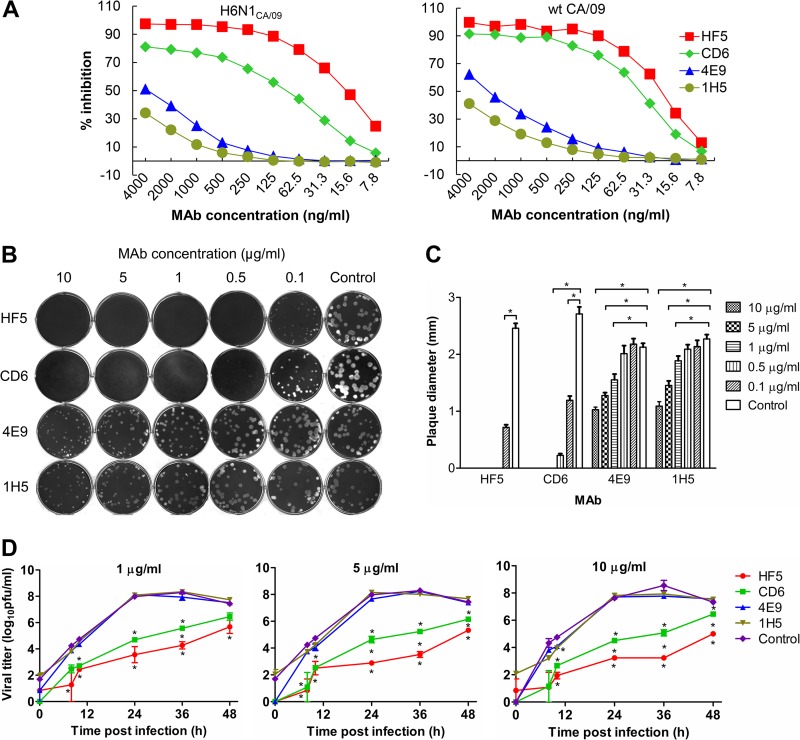
FIG 2.
Different functional properties of MAbs HF5, CD6, 4E9, and 1H5 in vitro. (A) Inhibition of CA/09 NA activity by each MAb measured by ELLA using H6N1CA/09 and wt CA/09 viruses. (B) CA/09 virus plaques formed in the presence of various concentrations of MAbs HF5, CD6, 4E9, and 1H5 (0.1 to 10 μg/ml) or the control MAb, 3A2 (10 μg/ml), in the overlay agar. (C) Diameters of the CA/09 virus plaques shown in panel B. Plaques from each treatment were randomly chosen, and the diameters were measured and compared to the diameter of the control. Shown are mean diameters (n = 20); SDs are shown with error bars. Diameters that were significantly different from those of the control (P < 0.05) are indicated by lines and asterisks. (D) Growth kinetics of CA/09 in MDCK cells in the presence of MAb HF5, CD6, 4E9, 1H5, or 3A2 (1, 5, or 10 μg/ml). Cells growing in 12-well plates were infected with CA/09 at an MOI of 0.001, and the viral titers in the supernatant at the indicated time points were measured by plaque assay. Shown are the average titers of duplicate wells; SDs are shown with error bars. *, P < 0.05. The asterisks above the green line or below the red line indicate a significant difference between the viral titers generated in the presence of the tested MAbs (CD6 or HF5) and the control MAb 3A2, asterisks between the green and red lines indicate significant differences between the viral titers generated in the presence of MAbs CD6 and HF5, and asterisks below the blue line in the right panel indicate significant differences between groups receiving 4E9 and 1H5 and the control group (which received 3A2).

