
FIG 9.
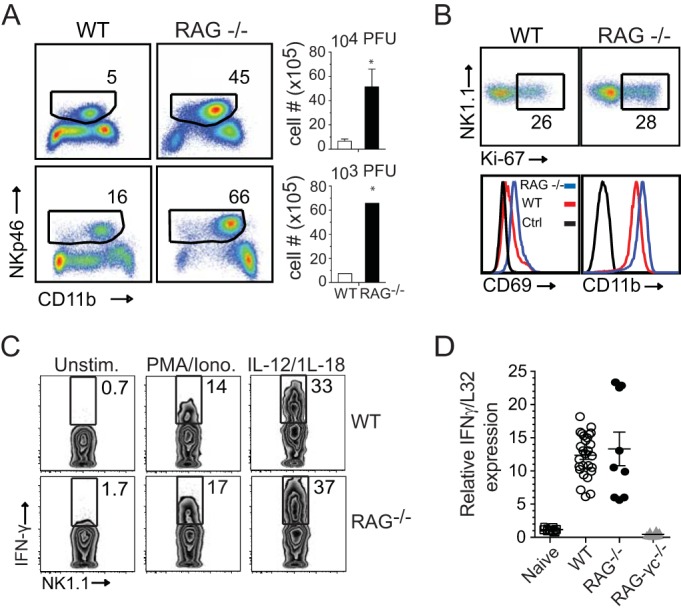
Enhanced NK cell responses in T cell-deficient RAG−/− mice infected with VACV-WR. Wild-type (WT), RAG−/−, and RAG−/− IL-2Rγ−/− C57BL/6J mice were infected intranasally with 1.25 × 10⁴ or 1.25 × 10³ PFU of VACV-WR, as indicated. (A) Representative FACS plots from day 9 postinfection showing NK cells (CD11b+ NKp46+) as percentages of CD3− lymphocytes. Right, histogram showing NK cell numbers presented as the mean results ± SEM from two separate experiments; n = 3 mice/group. Student's t test with the Bonferroni correction was used to determine statistical significance. *, P < 0.05, WT versus RAG−/−-infected mice. (B) On day 9 postinfection, lung cells were stained with anti-CD3, anti-NK1.1, and anti-Nkp46 antibodies and for Ki67 and assayed for NK cell proliferation and CD11b and CD69 expression on NK cells. (C) On day 9 postinfection with VACV-WR (1.25 × 10⁴ PFU), total lung cells were stimulated ex vivo with either PMA-ionomycin or IL-12 plus IL-18 for 5 h and then stained for intracellular IFN-γ. Representative zebra plots are shown for IFN-γ staining of CD3− NK1.1+-gated NK cells. The numbers in the plots indicate the percentages of NK1.1+ cells that stained for IFN-γ. Quadrant settings were based on the results for controls, using infected cells that were not stimulated (medium alone) with PMA-ionomycin or IL-12 and IL-18. Similar results were obtained in two separate experiments. (D) On day 9 postinfection with VACV-WR (1.25 × 10⁴ PFU), lungs were isolated and total RNA was collected. IFN-γ transcript levels were measured by real-time RT-PCR. Levels of mRNA were standardized to the level of the L32 housekeeping gene. Symbols indicate the results for individual mice, and bars- and whiskers indicate the mean results ± SEM. Student's t test with Bonferroni correction was used to determine statistical significance. *, P < 0.05 for RAG−/− versus RAG−/−/IL-2Rγ−/− mice.