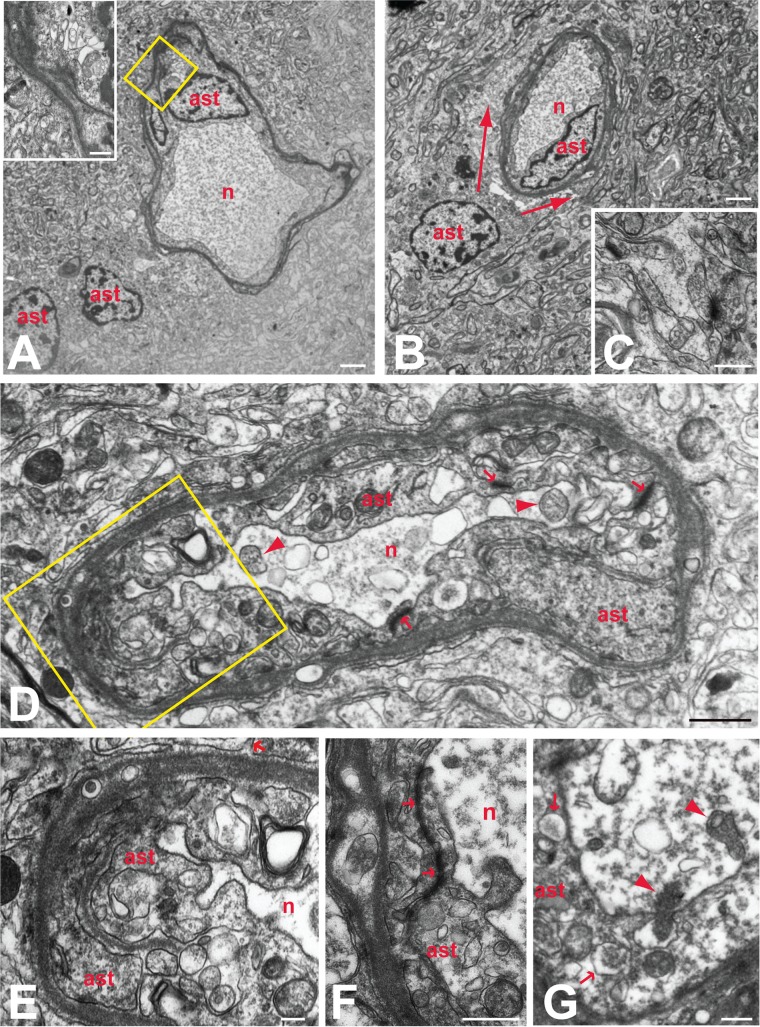
FIG 7.
Reactive astrocytes and astrogliosis in VZV-infected human brain. The relationships of reactive astroglia (ast) to degenerating neurons (n) are illustrated in the electron micrographs. Barrier astroctyes formed intimate relations with degenerating neurons, entirely isolating the degenerating neurons from the surrounding neuropil (A to D). In some cases, more than one reactive astrocyte contributed to this barrier (A), with the cells fusing to form a syncytium (inset in panel A). These astrocytes were also the source of thin interleaving processes that isolated synaptic profiles within the neuropil (C; arrow in panel E). Reactive astroglia in the adjacent neuropil also contributed processes that surrounded barrier astrocytes (defined by arrows in panel B), further isolating degenerating neurons from the brain parenchyma. Prominent accumulation of dense proteinaceous material underlying the outer plasma membranes was a characteristic feature of all barrier astrocytes (A, B, D to F). This material also was present in processes that invaded deeper layers of the astrocyte barrier to fuse with other processes (boxed area in panel D, which is shown at higher magnification in panel E). Tight junctions formed between processes within the glial barrier (arrows in panels D and F) contributed to the complete isolation of ensconced neurons. Neurons isolated by the barrier astrocytes characteristically contained accumulations of flocculent material, vacuolization, and mitochondria in various states of degeneration (arrowheads in panels D and G). Phagocytosis of degenerating neurons by barrier astrocytes was also a characteristic feature of barrier astrocytes. One of two degenerating mitochondria marked by arrowheads in panel G is within a portion of the soma being phagocytosed by the barrier astrocyte. Arrowheads within that barrier astrocyte identify phagosomes that are similar in morphology to the cytoplasm within the portion of the neuron being phagocytosed. Marker bars by panel: A and B, 2 μm; C and G, 500 nm; D, 1 μm; E, 200 nm; F, 600 nm.

