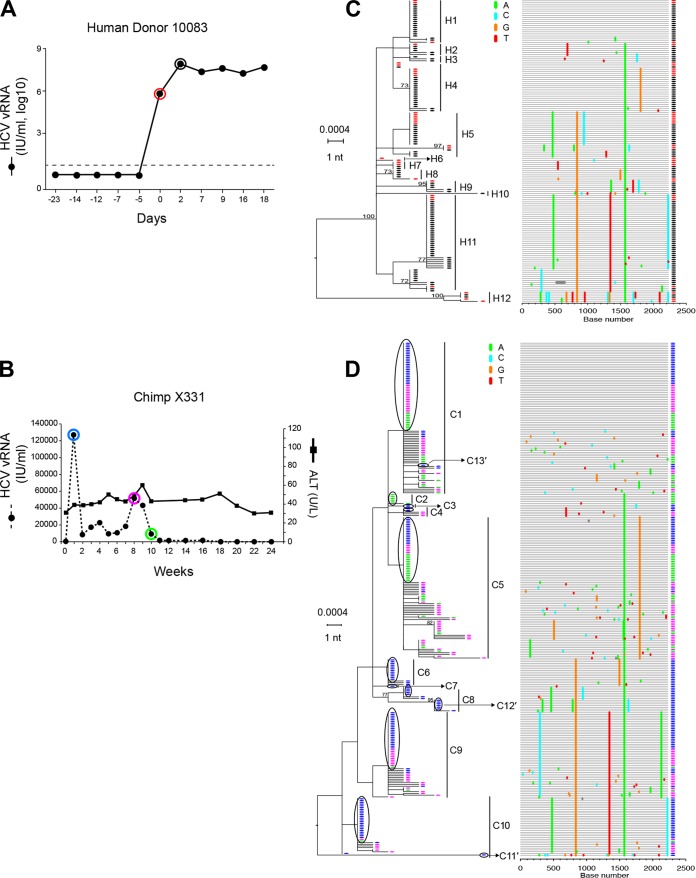
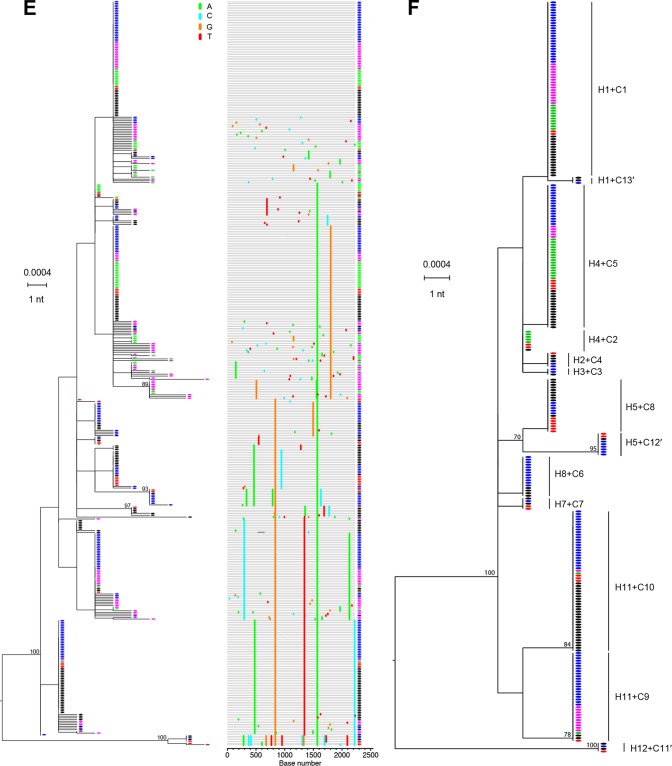
FIG 4.
HCV viral load kinetics and sequences in a human-to-chimpanzee transmission pair. (A) Viral load kinetics in acutely infected human subject 10083. Red and black circles indicate plasma samples subjected to sequence analysis. (B) Fifty milliliters of 10083 plasma from the day zero time point was infused intravenously into chimpanzee X331 at week 0. Plasma vRNA kinetics are indicated by filled dots, with blue, purple, and green circles indicating time points subjected to sequence analysis. ALT values are shown. (C) An ML phylogenetic tree (with sequences color-coded red and black to correspond to time points indicated in panel A) and a Highlighter plot show that the human subject 10083 was acutely infected by multiple viruses. The model described by Bhattacharya and coworkers (14; http://www.santafe.edu/~tanmoy/programs/HCV/) suggests a minimum of 12 T/F genomes (H1-H12). Panel D depicts sequences (color coded blue, purple, and green to correspond to time points indicated in panel B) from chimpanzee X331, and the Bhattacharya model suggests a minimum of 10 T/F viruses (C1 to C10). (E) Human (red and black) and chimpanzee (blue, purple, and green) sequences are combined. (F) An ML tree of sequences found to be identical between the human donor and the chimpanzee recipient. This tree reveals 13 T/F genome lineages (C1 to C13′) that were transmitted unaltered from humans to chimpanzees. These 13 transmitted genomes are enclosed in black ovals in panel D and include three lineages (C11′, C12′, and C13′) that were identified empirically (F) but not by the Bhattacharya clustering analysis (D).


