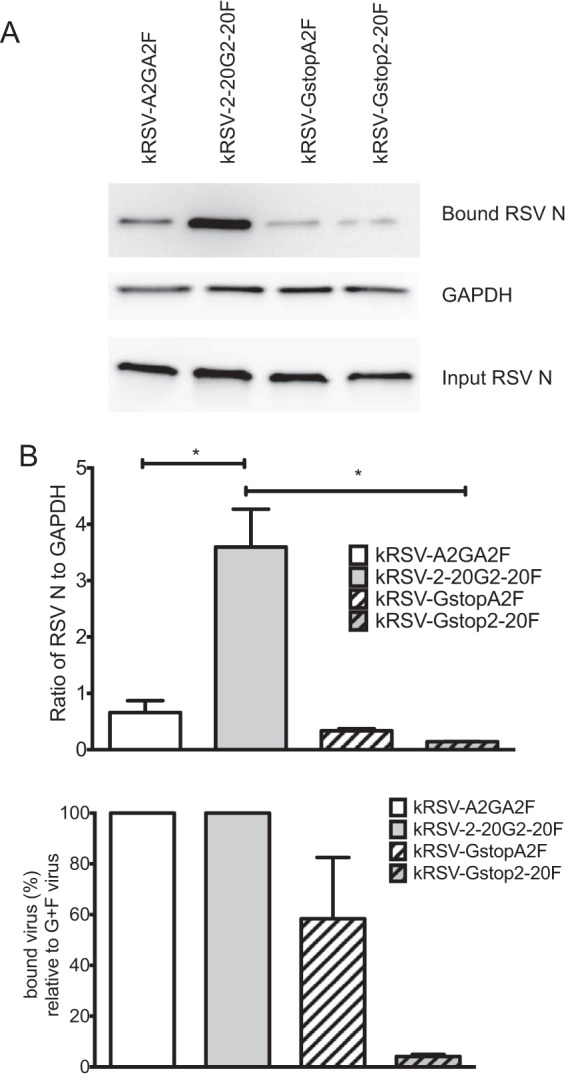
FIG 2.

Greater contribution of 2-20 G than A2 G to binding BEAS-2B cells. (A) Western blots showing results of a representative binding assay. Input virus inocula were normalized based on the N protein expression levels as shown on the bottom blot. (B) Densitometry analysis of bound virus. Virus binding activity (top panel) was calculated by normalizing the N level (bound RSV N from the top blot) to the GAPDH level of the sample. This value for the Gstop viruses was also normalized to that of its parental virus containing both F and G and is represented as the percentage of bound virus compared to the percentage of G+F virus (bottom panel). *, P < 0.05 (comparing the bracketed groups using one-way ANOVA). Data are shown as means ± SEM and represent the combined results of three replicate experiments.
