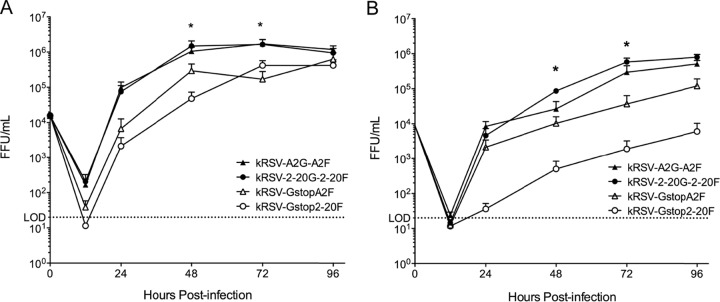
FIG 5.
Contribution of G protein to virus in vitro growth kinetics. HEp-2 cells (A) and BEAS-2B cells (B) were infected with kRSV-A2GA2F, kRSV-2-20G2-20F, kRSV-GstopA2F, or kRSV-Gstop2-20F using an MOI of 0.01. Time zero represents the calculated input titer. Virus titers at each time point thereafter were assayed by FFU assay. *, P < 0.05 (comparing the Gstop virus and parental GF virus at the same time point using one-way ANOVA). Data are represented as means ± SEM. LOD, limit of detection. FFU, fluorescent-focus unit. Each graph depicts data from the combined results of four independent experiments in each cell line.

