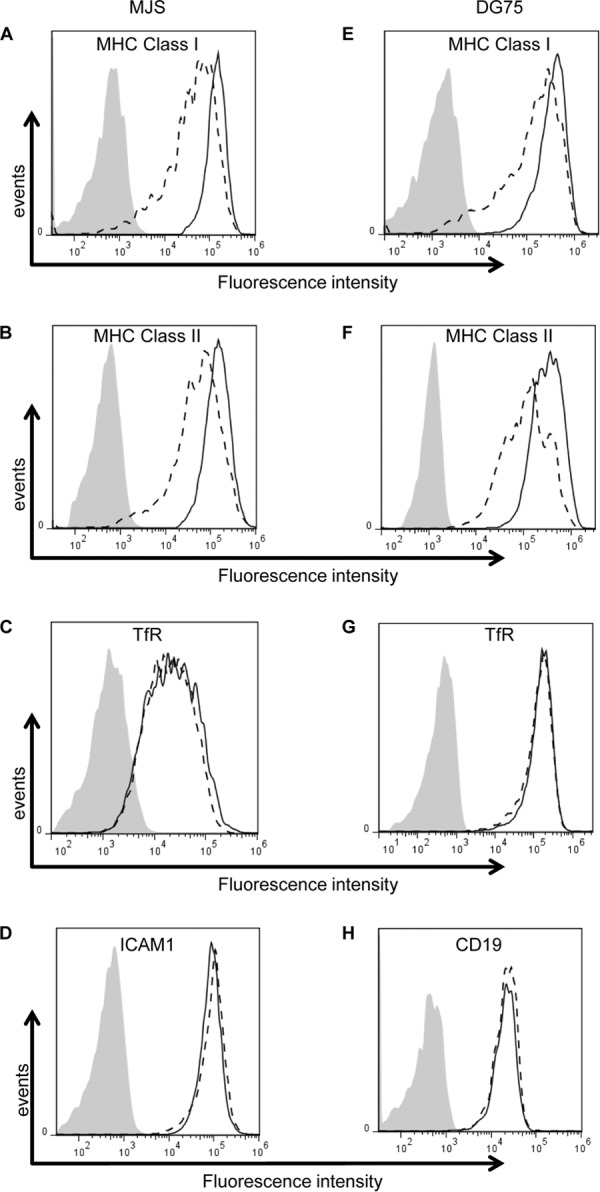
FIG 2.

BDLF3 expression induces the downregulation of surface MHC class I and MHC class II. MJS cells (A to D) and DG75 cells (E to H) were transiently transfected with the control-GFP or BDLF3-GFP plasmid. At 24 h posttransfection, two-color flow cytometry was used to measure surface levels of MHC class I (A and E), MHC class II (B and F), TfR (C and G), ICAM1 (D), and CD19 (H) in the GFP+ populations of control-GFP-transfected cells (solid lines) and BDLF3-GFP-transfected cells (dashed lines). The gray histograms denote background staining obtained with an isotype control antibody.
