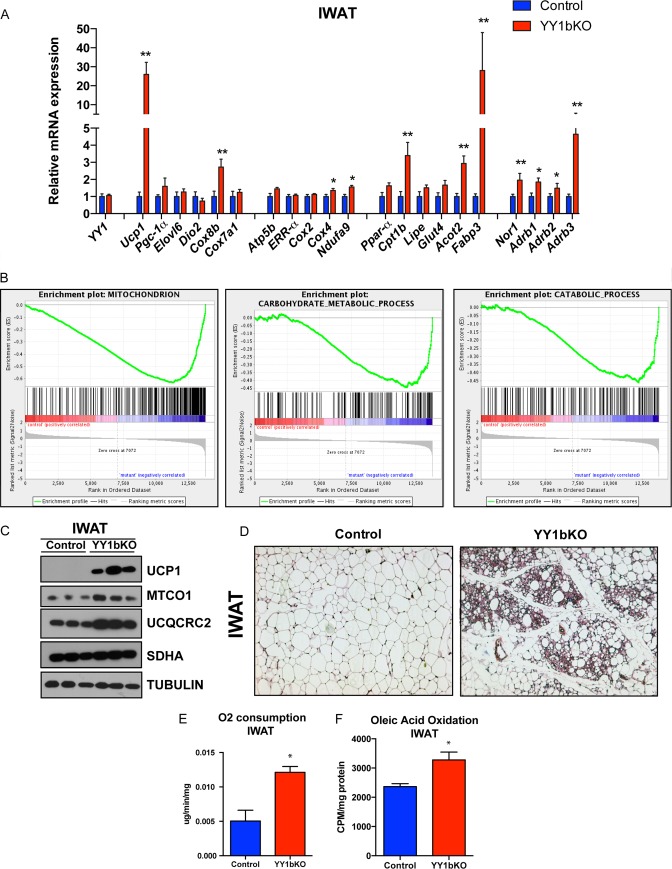
FIG 4.
Browning of subcutaneous white adipose tissue in YY1 KO mice fed a high-fat diet. (A) Gene expression of IWAT from YY1bKO versus control mice fed a high-fat diet. (B) Gene Set Expression Analysis (GSEA) of IWAT from YY1bKO versus control mice indicating increased catabolic pathways. (C) Western blot analysis of mitochondrial proteins in IWAT from YY1bKO versus control mice on a high-fat diet. (D) H&E staining of IWAT cross sections from YY1bKO versus control mice fed a high-fat diet. (E) Ex vivo oxygen consumption of IWAT homogenates from YY1bKO versus control mice measured by Clark electrode. (F) Fatty acid oxidation rates measured by released 14CO2 from IWAT homogenates incubated with 14C-radiolabeled oleic acid in YY1bKO and control mice. Data are represented as means ± SEM. *, P < 0.05, and **, P < 0.01, by t test (n = 6 to 10).

