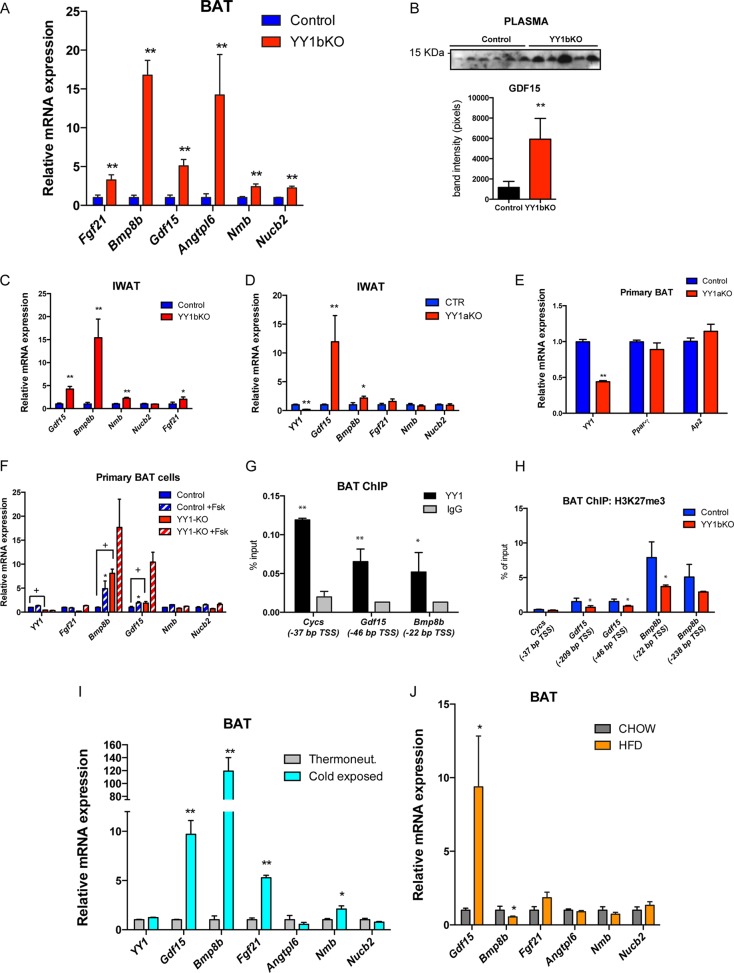
FIG 6.
Identification of brown fat-secreted factors, including the products of the Gdf15 and Bmp8b genes, elevated in brown adipose tissue of YY1 mutant mice. (A) Gene expression validation of identified secreted proteins by qPCR (n = 8). (B) Detection of plasma GDF15 by Western blotting and quantification of band intensities from YY1bKO versus control mice fed a high-fat diet (2 weeks). (C and D) Gene expression of IWAT from YY1bKO (C) and YY1aKO (D) mice fed a high-fat diet for 2 weeks (n = 6 to 8). (E) Gene expression of primary BAT cells from YY1aKO mice showing differentiation markers. (F) Gene expression of primary BAT adipocytes from control and YY1aKO mice treated with DMSO or 10 μM forskolin (n = 3). (G) YY1 ChIP in BAT from wild-type mice showing the relative binding versus IgG in Gdf15 and Bmp8b promoters. Cytochrome c (Cycs) was used as a positive control. The genomic position of YY1 binding is indicated as relative distance from the transcription start site (TSS) in base pairs. (H) ChIP of the repressive H3K27me3 mark in BAT from YY1bKO versus control mice (n = 3) in Gdf15 and Bmp8b promoters indicating the relative position of the TSS. Cytochrome c was used as the negative control. (I) BAT gene expression of wild-type mice exposed to cold or thermoneutrality for 4 days (n = 5). (J) BAT gene expression of wild-type mice fed on chow or a high-fat diet (HFD) (n = 6). Data are represented as means ± SEM. In panels A to E and G to H, * indicates P < 0.05 and ** indicates P < 0.01 (t test). Analysis of variance (ANOVA) with Bonferroni multiple comparisons was used in panel F (*, P < 0.05; +, P < 0.05).

